
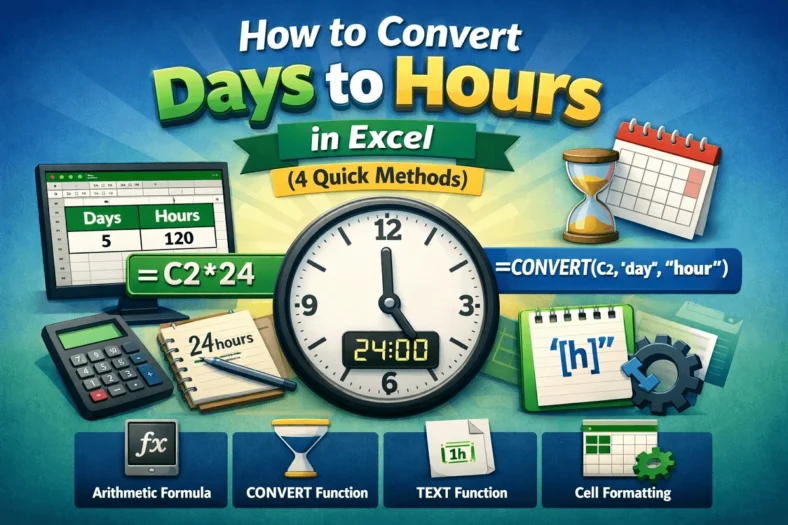
How to Convert Days to Hours in Excel (4 Quick Methods)
Converting days to hours means converting the day values into hour values. It gives a rough estimate of detailed, actionable data. The hourly values are often more important for payroll


Converting days to hours means converting the day values into hour values. It gives a rough estimate of detailed, actionable data. The hourly values are often more important for payroll

A chart’s data is the source from which it’s plotted. To select data for a chart in Excel, we can select it before creating a chart or select the source

The equation of a trendline is the closest relation between variables. To find the equation of a trendline in Excel, we can use the built-in feature or we can calculate

Coloring a chart by value assigns a unique color to each data point according to its value. To change the chart color based on value in Excel, we need to

A vertical or horizontal line is the benchmark or reference to highlight a specific point. To add a vertical line in an Excel graph, we need to either modify a

Left alignment is the alignment of an object on the left of some reference. “Left-align” in an Excel chart may indicate aligning a chart to a cell, aligning multiple charts,

The logarithmic scale is the representation of multiplicative changes rather than additive changes. In other words, each step is a multiplication of the previous number on a logarithmic scale. It

The axis scale is the range of values displayed along an axis. To change the axis scale in Excel, we need to access its maximum and minimum bounds. An axis

The trend percentage is an ambiguous term often used to describe the change of a value relative to a base term. To calculate the trend percentage in Excel, we need
