
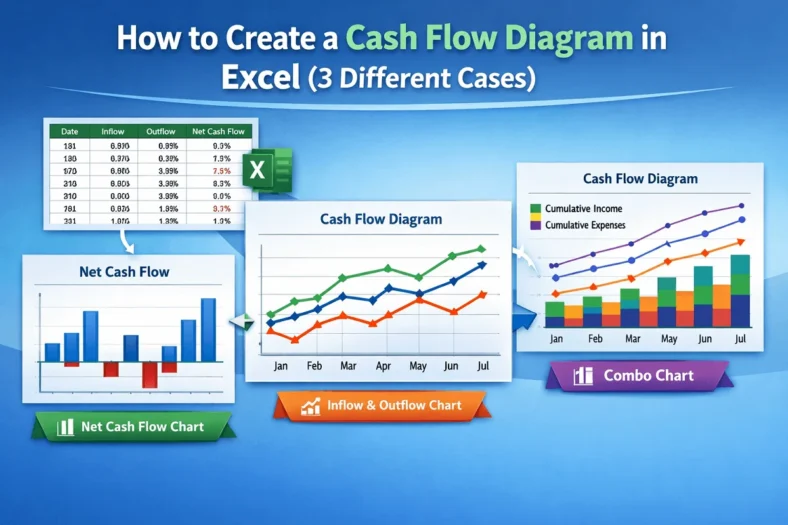
How to Create a Cash Flow Diagram in Excel (3 Different Cases)
Cash flow diagrams help show insights into the cash inflows and outflows of a business. People who are not familiar with accounting can find regular data ranges hard to interpret.


Cash flow diagrams help show insights into the cash inflows and outflows of a business. People who are not familiar with accounting can find regular data ranges hard to interpret.

In order to evaluate an asset and prepare for the next one, businesses need to calculate the depreciation of their properties. Among the methods of calculating depreciation, straight line depreciation

Finding the margin percentage is a common financial calculation in businesses. Imagine you bought some products for the purpose of resale, and the wholesaler determined the selling price of the

In a retail shop, calculating the selling price often becomes the responsibility of the shop owner. While a lot of people feel comfortable calculating the selling price using the markup

In a product-based business, determining the cost per unit is crucial for setting prices and calculating profit. Cost-per-unit calculations are useful for inventory management, pricing strategies, and project control. In

Year-to-date calculations are commonly used for budgeting, sales computations, and other data analysis purposes. If you have data for multiple years and want to sum up the data year-wise, you

To understand the condition of a business, it is important to calculate the year-over-year growth. A business owner might want to know the current year-over-year growth rate or predict the

In accounting, the weighted average is often used for inventory calculations. Instead of the normal average, weighted averages sometimes provide a better picture of the data for various statistical analysis.

Dividing the sum by the count is one of the most used calculations in the area of mathematics. Suppose you have the sum of the money spent on buying something,
