Excel Charts
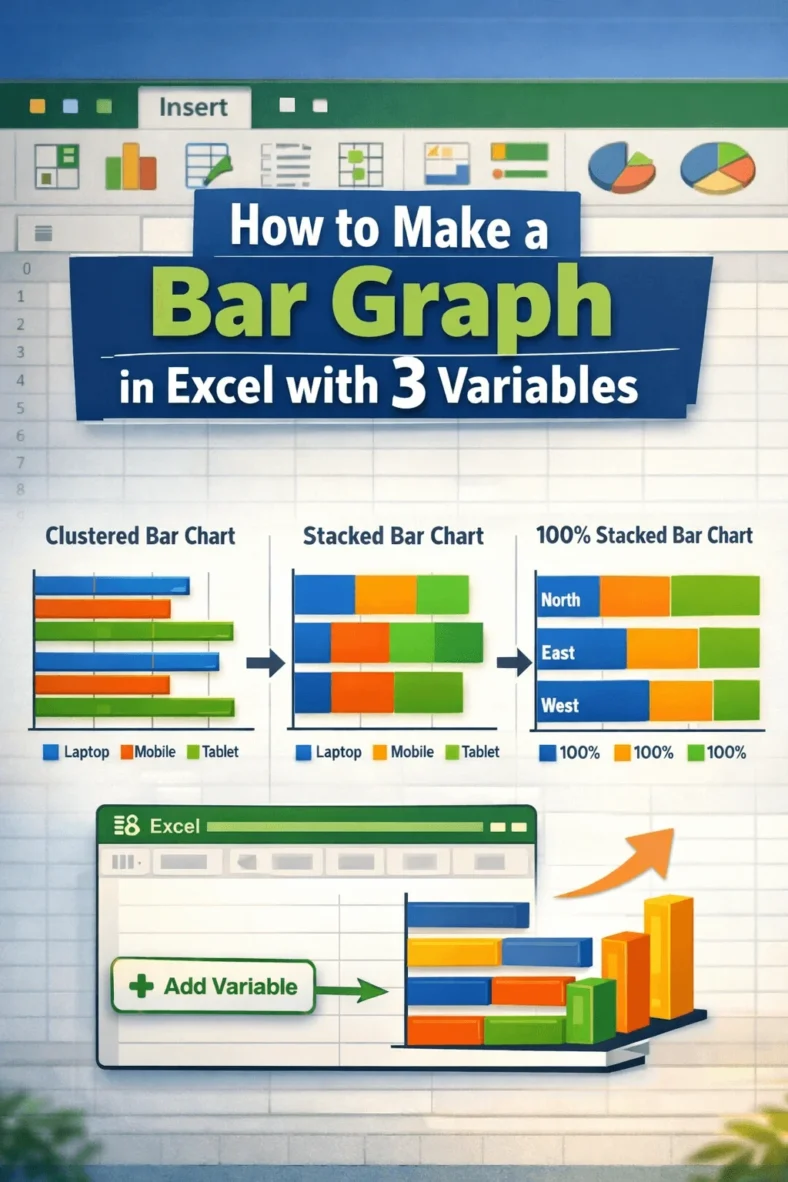
How to Make a Bar Graph in Excel with 3 Variables
In Excel, a bar graph or chart displays data using horizontal rectangular bars, where each bar’s length represents the data point’s value. It’s one of the most effective ways to

In Excel, a bar graph or chart displays data using horizontal rectangular bars, where each bar’s length represents the data point’s value. It’s one of the most effective ways to
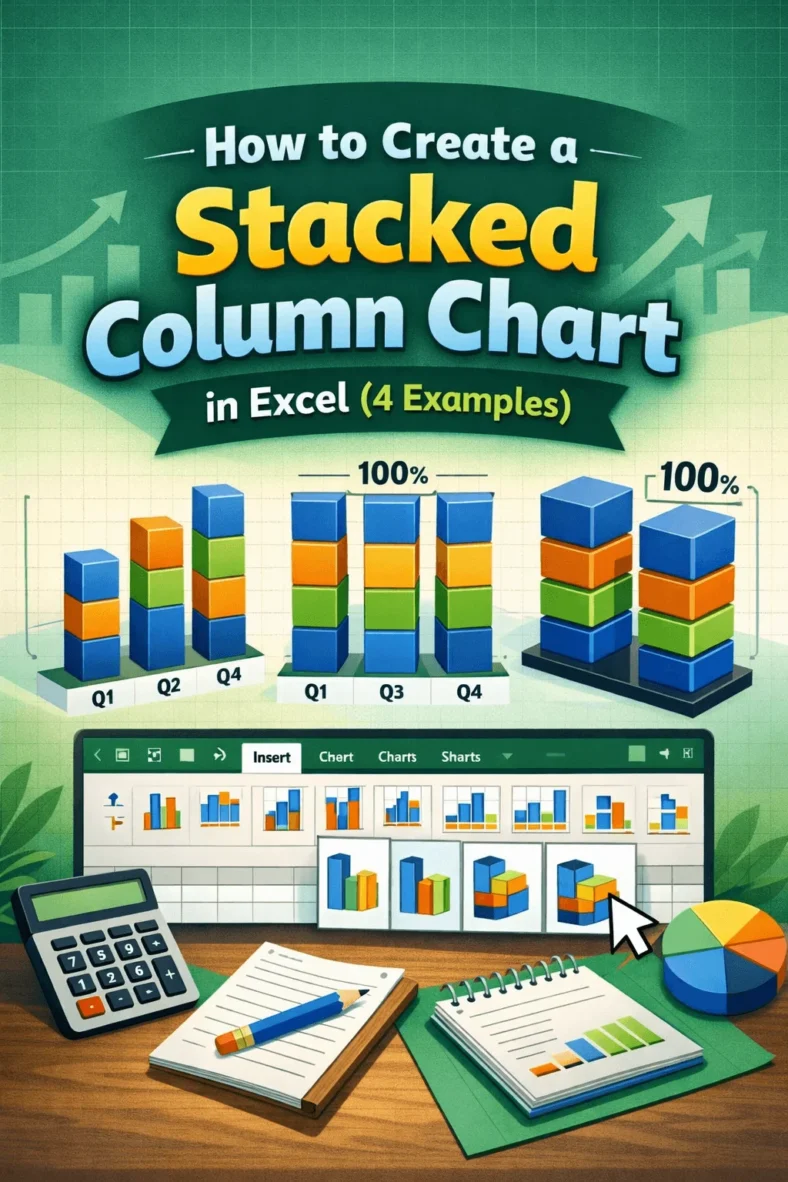
A stacked column chart allows for the comparison of components of a whole across different categories. Instead of showing separate bars, it stacks the values on top of each other,

Transposing multiple rows in groups to columns in Excel means converting repeated data entries into a horizontal format. Instead of having the same category listed multiple times with different values,

Transposing data in Excel means switching rows and columns so that data that was arranged horizontally becomes vertical and vice versa. It is often useful when you want to reorganize
An employee database in Excel is a structured table that stores essential information about employees, such as their names, job titles, departments, contact details, and joining dates. It helps HR

Structured reference in Excel is a way to refer to table data by column names instead of cell references. When you convert a range into an Excel Table, Excel allows

Converting an image into a table in Excel means turning a picture that contains tabular data into actual editable cells. You can then work with these cells by sorting, filtering,

Sometimes, you may need to add a column to an existing table in Excel to expand your data and include new information. For example, if you’re managing a sales report

A table in Excel is a structured range of data that comes with built-in features like filtering, automatic formatting, and structured references. These features make it easier to organize, analyze,