Excel for Statistics
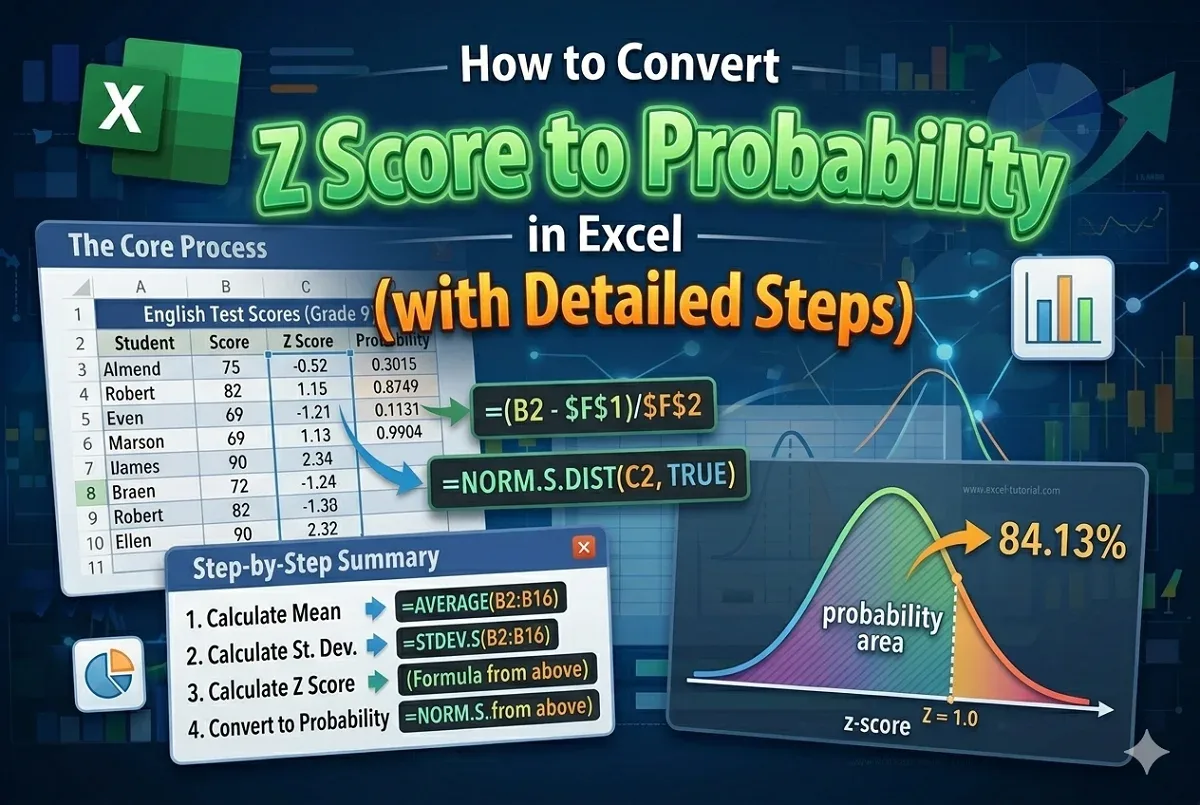
How to Convert Z Score to Probability in Excel (with Detailed Steps)
Learn how to convert a Z score to probability in Excel with step-by-step instructions, formulas, and practical examples for beginners.
Read article

66 articles
Learn how to convert a Z score to probability in Excel with step-by-step instructions, formulas, and practical examples for beginners.
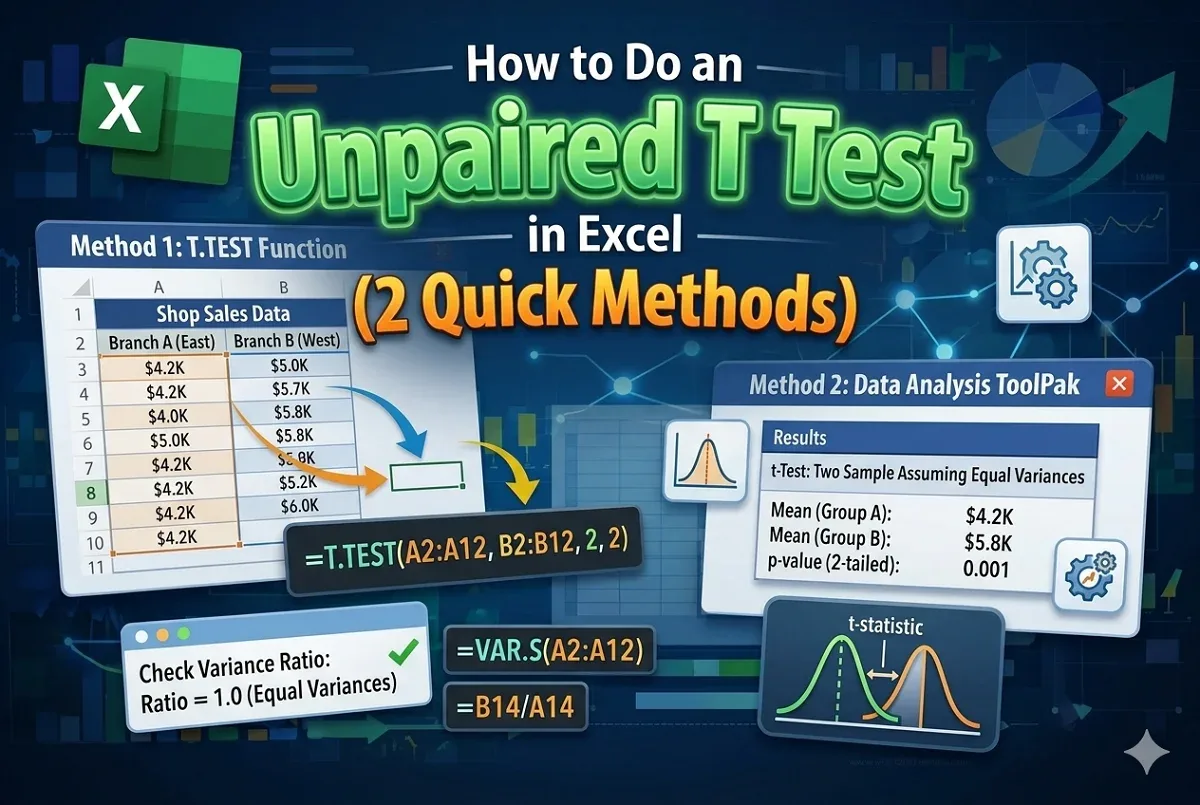
Learn how to do an unpaired t test in Excel using the T.TEST function or the Data Analysis ToolPak with step-by-step guidance in minutes.

Learn how to do a paired t-test in Excel using the T.TEST function and the Data Analysis ToolPak with step-by-step instructions easily.

Learn how to perform a two-sample t-test in Excel using the T.TEST function and the Data Analysis ToolPak with clear steps and examples.
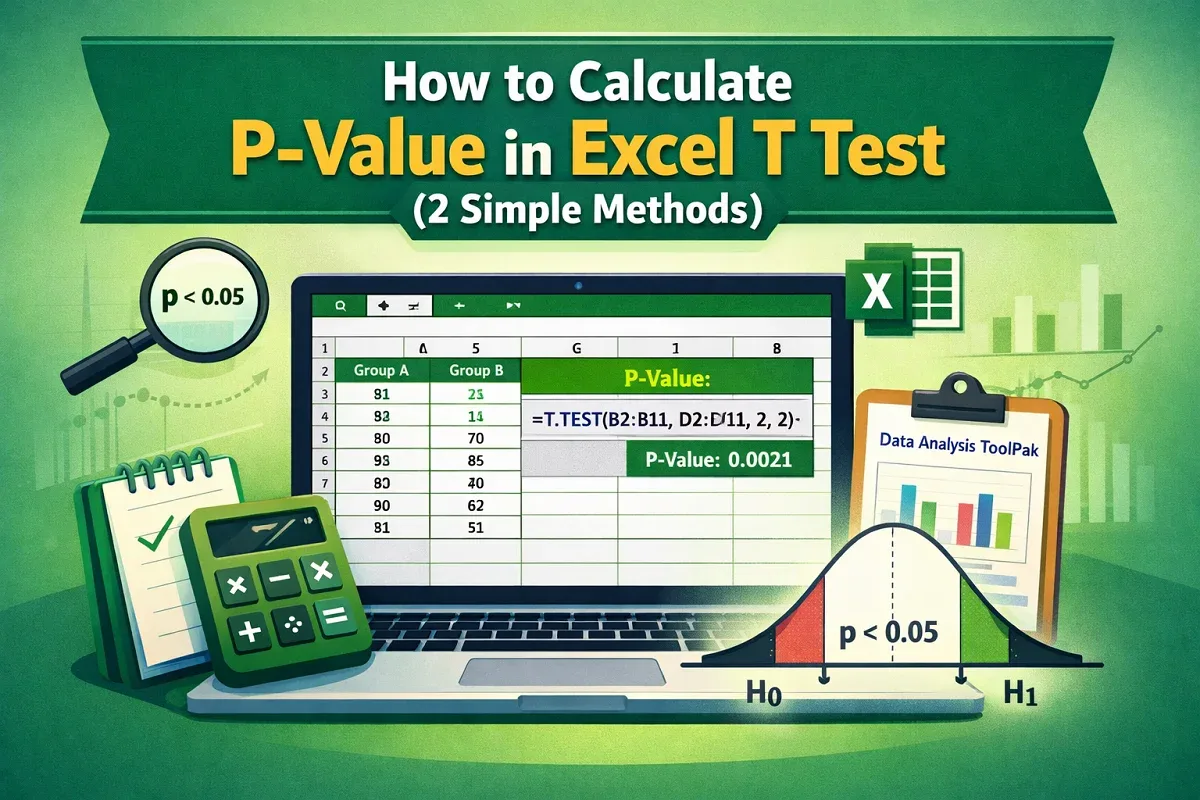
Learn how to calculate P-value in Excel T-Test using the T.TEST function and the Data Analysis ToolPak with step-by-step guidance.

Learn how to perform descriptive statistics in Excel using the Data Analysis ToolPak, with setup steps and clear result explanations.

Learn how to add tally marks in Excel using formulas, bar charts, and VBA code with step-by-step methods for quick and easy counting.
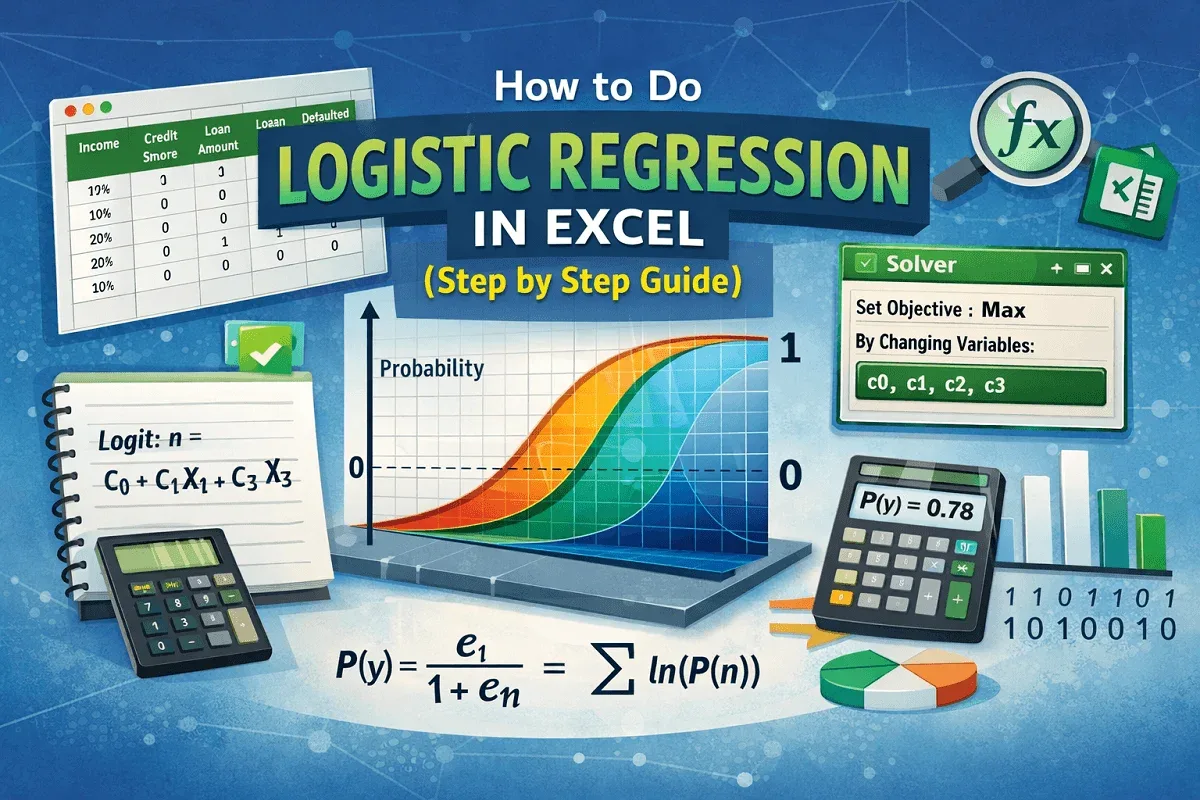
This article explores what logistic regression is and the detailed steps on how to do logistic regression in Excel using the Solver Add-in.
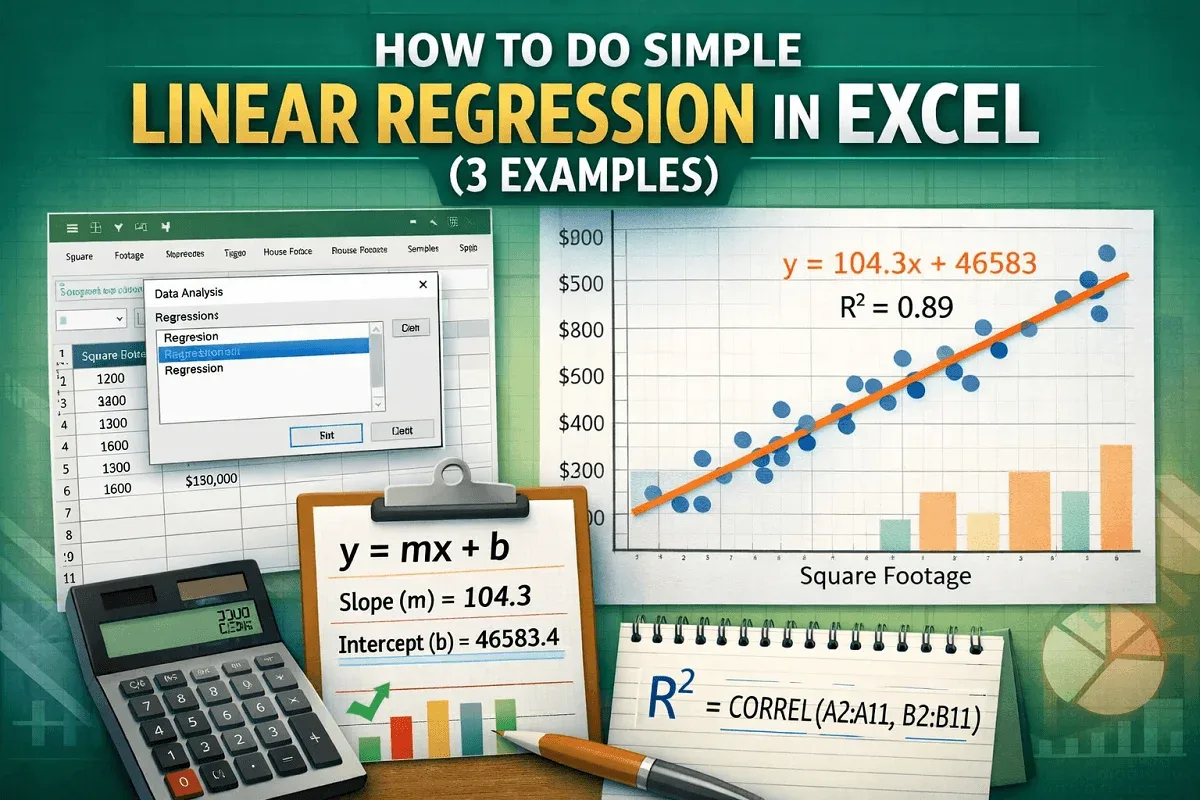
This article explores what linear regression is and how to do linear regression in Excel with Data Analysis ToolPak, formulas and charts.
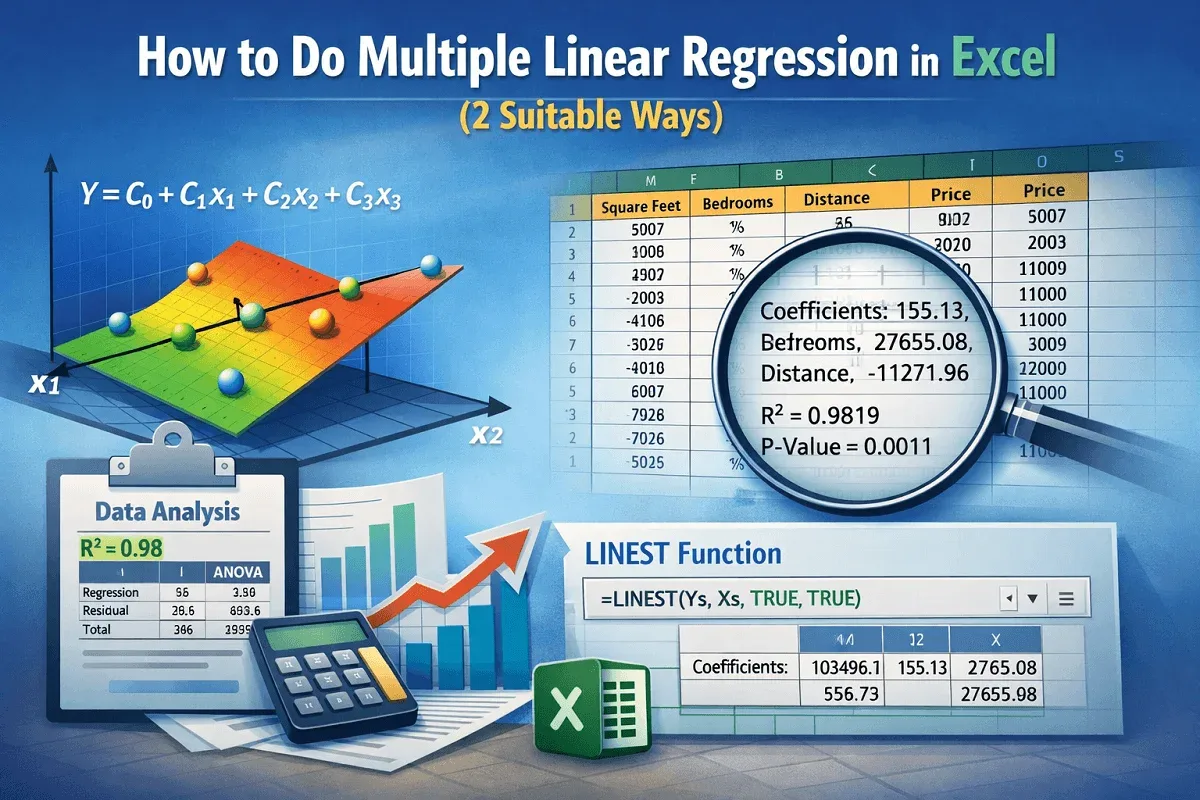
This article explores how to do multiple linear regression in Excel with Data Analysis ToolPak & LINEST function, with discussion of results.
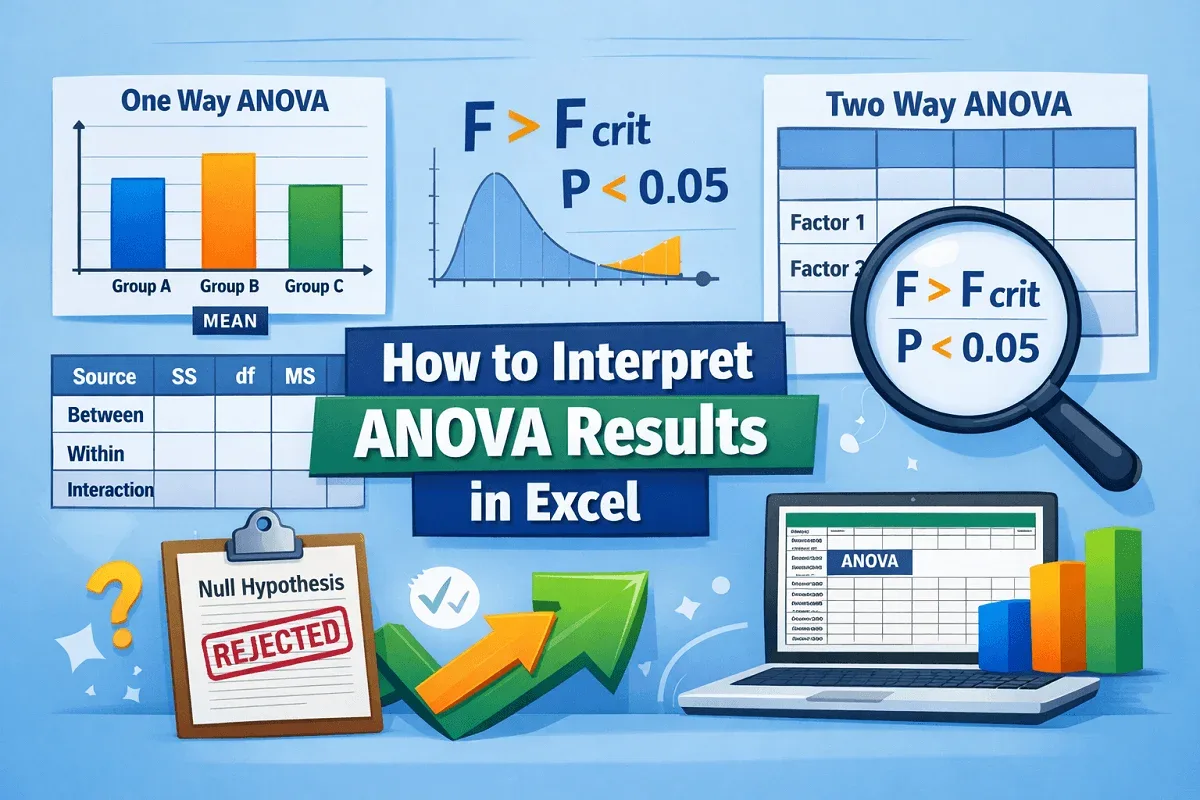
This article explores how to interpret ANOVA results in Excel for one way and the two way ANOVA tests using the Data Analysis ToolPak.
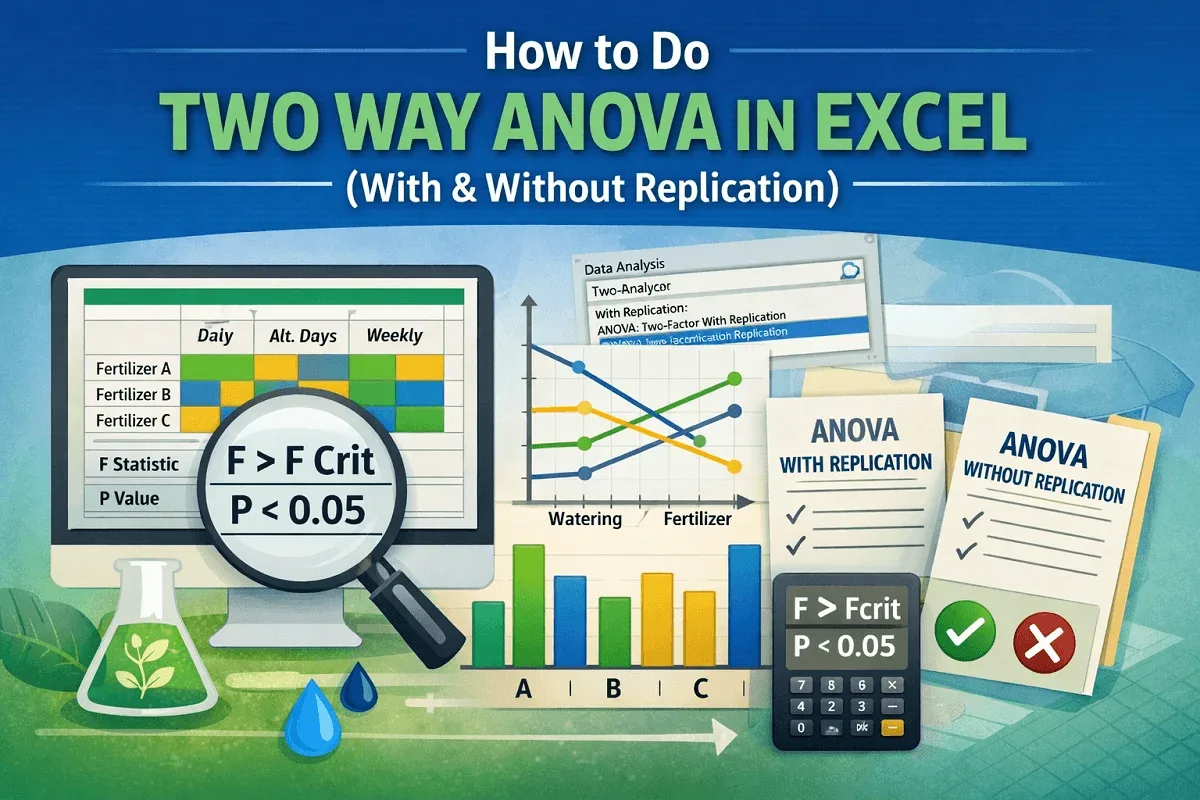
This article explores how to do two way ANOVA in Excel with and without replication conditions using the Data Analysis ToolPak.