
When we work with normal or approximately normal data and want to compare each value to the mean, we use the z-score to standardize the data. It lets us compare all the data points on the same scale. However, a simple z-score only shows us how far a data point is from the mean. It does not tell us how often the value occurs, i.e., how rare or common the value is. So, for this purpose, we need to convert the z-score to probability in Excel.
Suppose you are working with the scores of a test of freshmen and want to know the probability of the score of each student. In such a case, you can calculate the z-score for each student and then convert it into a probability. This will tell you the percentage of students who meet the criteria.
In this article, we will explain how you can calculate the z score in Excel using the AVERAGE and STDEV.S functions and then convert the score to probability using the NORM.S.DIST function.
➤ First, select cell E1 and write Mean.
➤ Then, click on cell F1 and insert the following formula:
=AVERAGE(B2:B16)
➤ Click on cell E2 and write St. Dev.
➤ Now, select cell F2 and insert the following formula:
=STDEV.S(B2:B16)
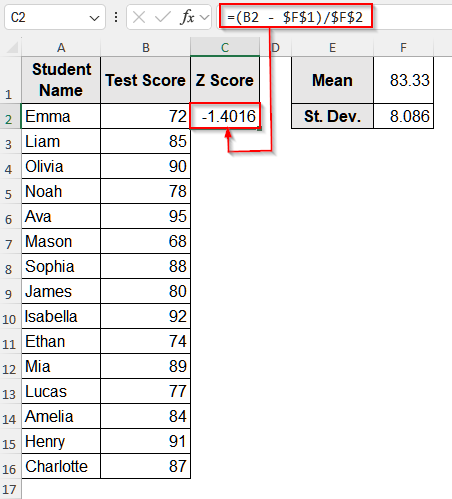
➤ Select cell C1 and write Z Score.
➤ Click on cell C2 and insert the following formula:
=(B2 – $F$1)/$F$2
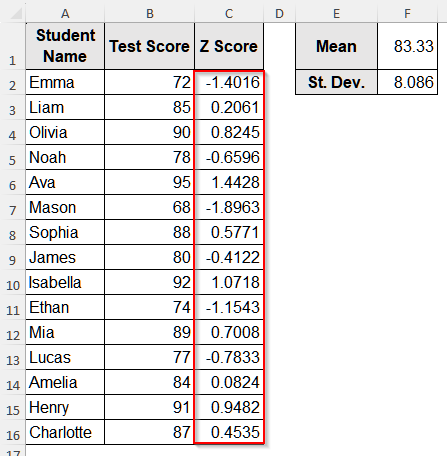
➤ Now, drag the cursor down to get the z-score for all the students.
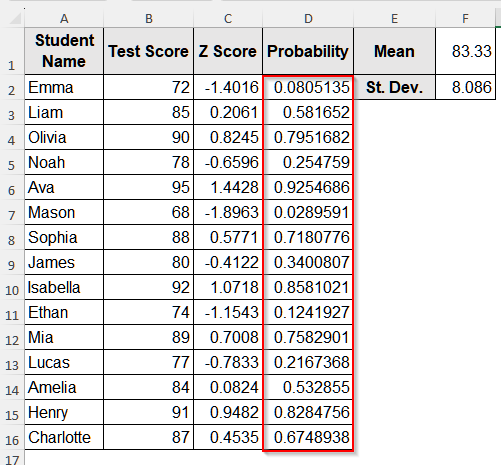
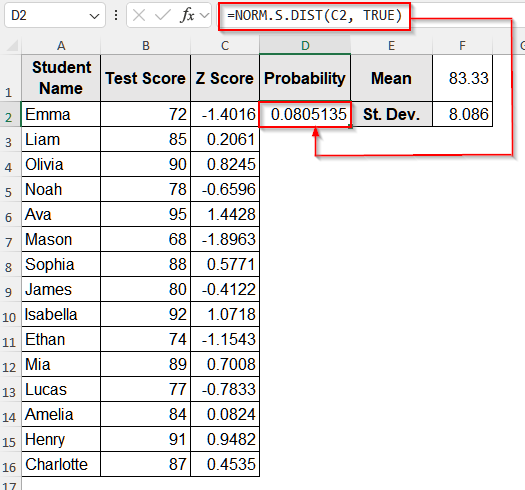
➤ Click on cell D1 aand write Probability.
➤ Select cell D2 and insert the following formula:
=NORM.S.DIST(C2, TRUE)
➤ Now, drag the cursor down to fill all the cells for the rest of the students.
What Is a Z Score in Statistics?
The Z-score is a statistical measure that shows the relationship between the mean of a group of values and a specific value of that group. It is a numerical value that is measured relative to the standard deviations from the mean of a dataset. To calculate the z-score, we have a statistical formula:
Z=(X-μ)/σ
Here,
Z = Z-score
X = Any individual data point
μ = Mean of the dataset
σ = Standard deviation of the dataset.
Steps to Convert Z Score to Probability in Excel
To convert a z-score to probability, we need to calculate it first, and then, using the NORM.S.DIST function, we can convert it to a probability in Excel.
We will use the dataset below to calculate the z-score and convert it into a probability in Excel.
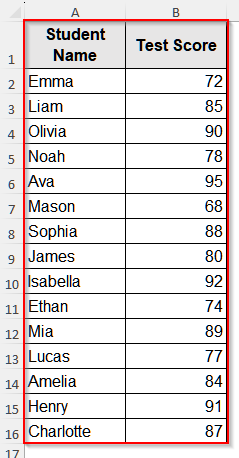
This dataset contains the test scores in English of students in grade 9. We will calculate the z-scores of these test scores for each student and then convert them into probabilities.
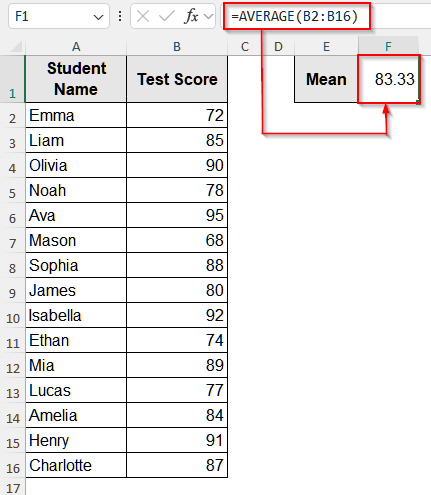
Step 1: Calculate the Mean
To calculate the z score, we will follow the traditional z-score formula. So, let’s calculate the mean of this test result.
➤ First, select cell E1 and write Mean.
➤ Then, click on cell F1 and insert the following formula:
=AVERAGE(B2:B16)
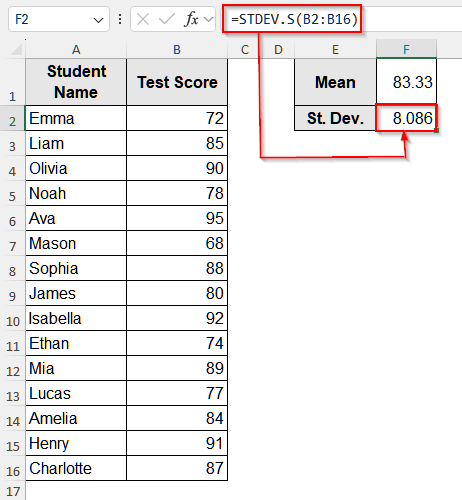
Step 2: Calculate the Standard Deviation
After calculating the mean, we need to calculate the standard deviation to divide the quantity by it.
➤ Click on cell E2 and write St. Dev.
➤ Now, select cell F2 and insert the following formula:
=STDEV.S(B2:B16)
Step 3: Calculate the Z Score for Each Student
Now that we have both the mean and the standard deviation of the dataset, we can calculate the z-score for each student.
➤ Select cell C1 and write Z Score.
➤ Click on cell C2 and insert the following formula:
=(B2 - $F$1)/$F$2
➤ Now, drag the cursor down to get the z-score for all the students.
Step 4: Convert Z Score to Probability
We have the z-scores for each student now. So, let’s convert these scores to probability.
➤ Click on cell D1 aand write Probability.
➤ Select cell D2 and insert the following formula:
=NORM.S.DIST(C2, TRUE)
➤ Now, drag the cursor down to fill all the cells for the rest of the students.

Frequently Asked Questions (FAQs)
Is There a Single Formula to Calculate Z Score Directly in Excel?
Unfortunately, there is no single formula to calculate the z-score directly in Excel. You need to calculate the mean and standard deviations separately to find the z-score in Excel.
Can I Use the Z Test on Data That is Not Normally Distributed?
No, you should not do a Z-test on data that is not normally distributed or approximately normal. The z test follows the assumption that the sampling mean of the distribution is normal. So, if the data is not normally distributed, it will violate this assumption, and the result will be incorrect.
How Do I Know If My Data Is Normally Distributed?
You can either check visually or check the skewness and kurtosis to decide whether the data is normally distributed or not. Plot a histogram to check visually whether the data is normally distributed. However, it is better to check the skewness and kurtosis. Just run these two codes, =SKEW(range) and =KURT(range), and if the skewness is around 0 while the kurtosis is around 3, your data is normal.
Wrapping Up
In this article, we have learned how to calculate and then convert a z-score to probability in Excel. For this, we used the traditional formula, calculated the mean with the AVERAGE function, and the variance with the STDEV.S function. Then we converted the z-scores to probability using the NORM.S.DIST. Try this method and let is know if you have any inquiries or want to share any feedback.