
When our dataset contains observations on two separate groups that are not connected by any factor, we need to do an unpaired or independent sample t-test on them to analyze the difference between their means. Because if you compare their means directly or use a paired t-test to determine the relationship, it will lead to biased results, as both groups are independent.
Suppose you want to compare the sales of two different branches of a shop located in different regions. In this case, the two groups are independent of each other, and so, to see whether there are any statistically significant changes between the average sales of these two branches, you need to conduct an unpaired t-test.
In this article, we will explain two different methods, including the T.TEST function and the Data Analysis ToolPak, to perform an unpaired t-test in Excel.
➤ First, we need to check whether the two groups of our data have equal or unequal variances.
➤ Select cell B15 and insert the following formula:
=VAR.S(B2:B13)
➤ Now, click on cell C15 and insert the following formula:
=VAR.S(C2:C13)
➤ Now, using the rule of thumb, that is, if the ratio of larger and smaller variances is 3 or less, we can assume the groups have equal variances. Or else, the variances are unequal. Remember, the closer the ratio is to 1, the variances are more likely to be equal. In our data, the variance of the West region profit is higher than the East region profit.
➤ Select cell B17 and insert the following formula and press Enter:
=C15/B15
➤ Here, we get the ratio as approximately 1. So, we can assume the two variances are equal.
➤ Now, click on cell D1 and write the Unpaired T Test.
➤ Then, select cell D2 and insert the following formula:
=T.TEST(B2:B13, C2:C13, 2, 2)

Conduct an Unpaired T Test in Excel with the T.TEST Function
The T.TEST function is one of the common methods to perform a t-test in Excel. With this function, you can do any type of t-test in Excel, including an unpaired t-test.
We will use the dataset below to explain how you can use the T.TEST function to do an unpaired t-test in Excel.

This is the profit dataset for the last year for two branches of a store. From this data, we want to see if there are any statistically significant changes between the means of these two branches.
Steps:
➤ First, we need to check whether the two groups of our data have equal or unequal variances.
➤ Select cell B15 and insert the following formula:
=VAR.S(B2:B13)

➤ Now, click on cell C15 and insert the following formula:
=VAR.S(C2:C13)

➤ Now, using the rule of thumb, that is, if the ratio of larger and smaller variances is 3 or less, we can assume the groups have equal variances. Or else, the variances are unequal. Remember, the closer the ratio is to 1, the variances are more likely to be equal. In our data, the variance of the West region profit is higher than the East region profit.
➤ Select cell B17 and insert the following formula and press Enter:
=C15/B15

➤ Here, we get the ratio as approximately 1. So, we can assume the two variances are equal.
➤ Now, click on cell D1 and write the Unpaired T Test.
➤ Then, select cell D2 and insert the following formula:
=T.TEST(B2:B13, C2:C13, 2, 2)
Here,
The first range, B2:B13, is the range for the East Region Profit data. Make sure to change it with your own data range.
The second range, C2:C5, is the range for the West Region Profit data.
The first 2 tell Excel that this is a two-tailed t-test. That is, we will check whether the change is negative or positive.
The last 2 indicate that our t-test is an unpaired test assuming equal variances.

Perform an Unpaired T Test in Excel Using the Data Analysis ToolPak
If you prefer to use built-in functions rather than formulas in Excel, then the Data Analysis ToolPak is a perfect option to perform an unpaired t-test for you. It also shows a few statistical calculations, including mean, standard deviation, degrees of freedom, etc. So, if you need to write a detailed report on your analysis, this tool is helpful for you.
Steps:
➤ First, we will enable the Data Analysis ToolPak because, regardless of being a built-in feature in Excel, this tool stays hidden.
➤ Go to the File option from the menu bar at the top of the data.

➤ Then, select Options from the new page.

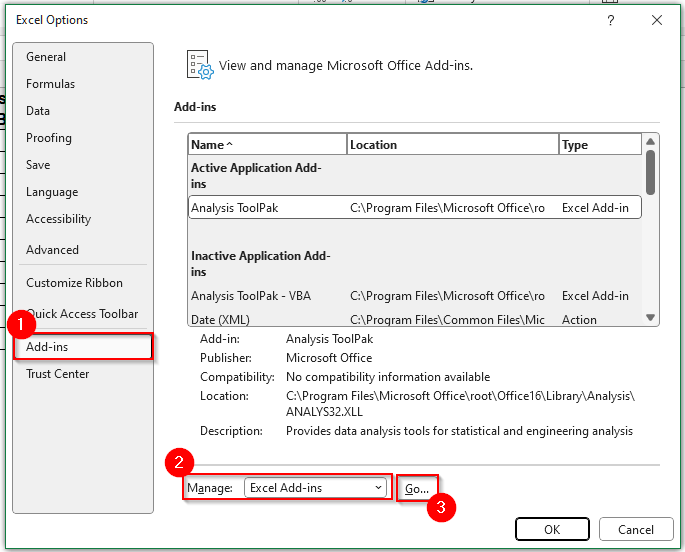
➤ Now, a new window appears. Click on Add-ins and then in the box beside the Manage option, choose Excel Add-ins. Then, click on Go.
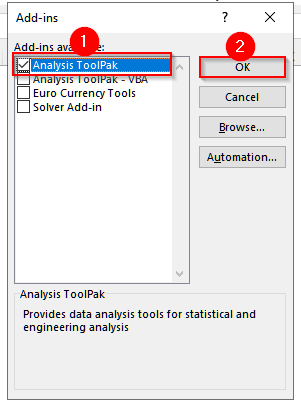
➤ It will take you to a new pop-up. Select the Analysis ToolPak in it and then click OK.
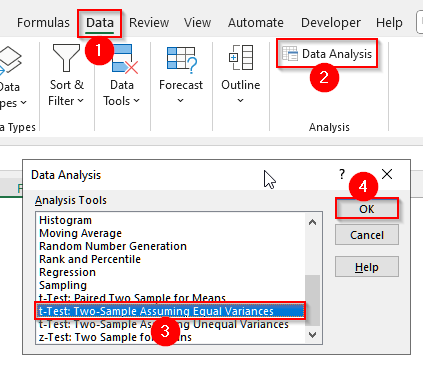
➤ Now, go to the Data tab on the upper menu bar, and you will see a new feature named Data Analysis appear under it. Click on it, and a pop-up will appear.
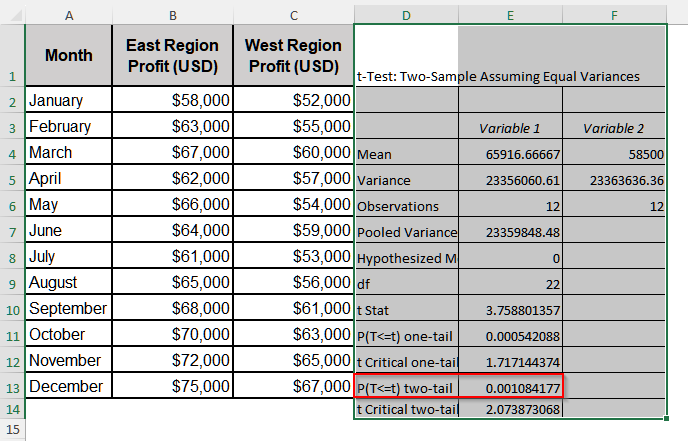
➤ On it, click on t-Test: Two Sample Assuming Equal Variances and then select OK.
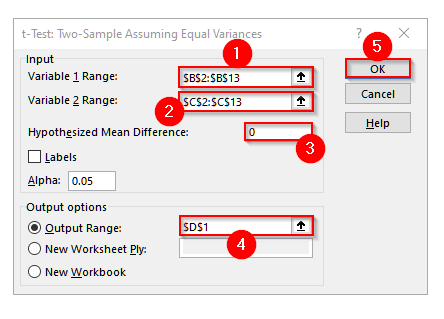
➤ Now, you will see another pop-up. In it, for Variable 1 Range, select the range of East Region Profit, i.e., B2:B13, and for Variable 2 Range, select the data range of West Region Profit, i.e., C2:C13.
➤ Then, write 0 in the box for the Hypothesized Mean Difference and in the Output Range, select cell D1. Finally, click OK.
➤ Now, you will find the result of the unpaired t-test beside your dataset.
Frequently Asked Questions
What is a One-Tailed t-test?
A one-tailed t-test is used to test the relationship between the population and the sample mean in only one direction. That is, it tests either an increase or a decrease. Usually, when we work with financial data like investment data and want to see the relationship, we use the one-tailed t-test.
Is 0.05 or 0.01 p-value better for a T Test?
Usually, a 0.01 p-value is considered better for any statistical test than a 0.05 one. Because 0.05 means there is a 5% chance that the result happened due to random effect, while 0.01 means there is 1% chance of randomness. However, 0.05 is widely accepted, and if you get a 0.01 p-value, you can conclude the test is highly significant.
What does T value 3.8 mean?
A t value or t statistic tells us how far our sample mean is from the population mean or from another sample mean in units of standard error. And generally, a t-value of 2 or more is considered statistically significant. So, a t-value of 3.8 indicates the two group means are significantly different.
Wrapping Up
In this article, we have learned two different methods to conduct an unpaired t-test in Excel. In case you need a quick and simple result, use the T.TEST function and interpret the result based on the p-value. On the contrary, if you want a make a detailed report, go for the Data Analysis ToolPak. Reach out to us if you have any inquiries or any feedback.