For Excel users, rotating a table has several meanings, including rotating the data structure only, visually rotating by treating the table as a picture, and flipping or transposing the table. In ...
Excel tables are structured ranges of data with added functionality, such as automatic column headers, built-in filtering and sorting, and predefined styles/formatting. They make managing, analyzing, ...
When a column in your dataset has multiple common values in groups, highlighting every other common group allows you to better visualize your data. It enables users to quickly scan, compare, and ...
With Excel's conditional formatting feature, you can highlight cells that contain any text from a predefined list. It's often used for tasks like flagging specific products, identifying key ...
To highlight cells in a data range based on a date stored elsewhere in your sheet, you need to use a formula with an absolute reference (fixed with a dollar sign, $). Such formatting is used for ...
In general, Excel's conditional formatting is used to highlight a cell based on its own value. However, you can use a formula to format an entire column based on the value of a different column. It ...
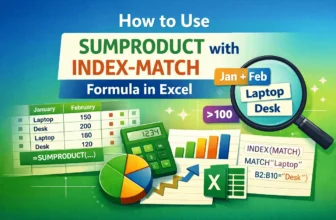
In a typical INDEX-MATCH formula, MATCH finds the row/column number of a value and INDEX returns the value at that position. The SUMPRODUCT function is used to sum values that meet conditions. ...
With Excel's Conditional Formatting feature, you can apply formatting (e.g., color fills, font changes, or borders) to cells based on specific rules. Excel's built-in Text That Contains option only ...
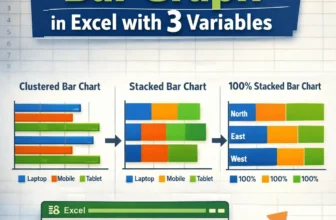
In Excel, a bar graph or chart displays data using horizontal rectangular bars, where each bar's length represents the data point's value. It’s one of the most effective ways to compare categories or ...