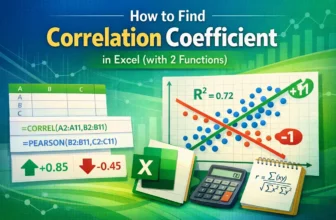
The key to data analysis is understanding how variables are related. In this tutorial, you will learn how to find the correlation coefficient in Excel and interpret the findings. By calculating the ...
An equation in an Excel graph provides information about the scattered data in the graph. To show the equation in an Excel graph, you need a suitable chart for a trendline and enable the option to ...
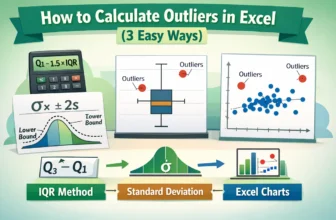
Outliers can distort your data and lead to inaccurate results. This article will teach you how to calculate outliers in Excel and help you deal with outliers. Whether you're analysing website ...
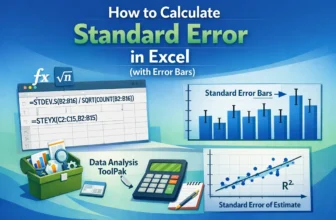
Understanding how data differs is important whether you're comparing airline performance, assessing marketing strategies, or summarizing survey findings. Standard error is one such statistic that ...
A trendline shows the general direction of data points in a chart. Trendlines generally smooth out short-term fluctuations and reveal long-term patterns in a timeline. To add a trendline in Excel ...
A trendline is a line that shows the overall flow or pattern of data. Inserting a trendline in an Excel cell can provide a quick look at the actual data trend beside it.In Excel, the trendline is ...
A trendline is a line showing the data movement along an axis. Adding multiple trendlines in Excel can show different trends for a single series or trends of each one for multiple series.You can ...
The error bar is the measurement of the accuracy of a data point. A standard deviation error bar in Excel shows the data point deviations from the mean/average.In other words, the standard ...
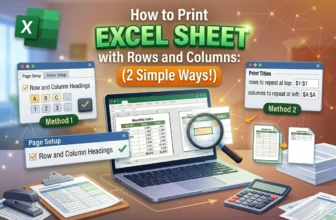
If your Excel sheet spans multiple pages, then you must display either the default row numbers and column letters or the row and column headers for clear identification. This article covers these two ...