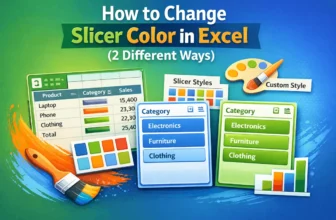
Slicers are used to filter data in Excel Tables, Pivot Tables, and Pivot Charts. While they inherit colors from the workbook's theme by default, you can customize a Slicer's color to make it look ...
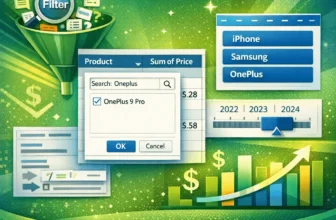
Pivot Tables are used for summarizing and analyzing large datasets in Excel. To focus analysis on specific subsets of data, filtering is important. While manually checking boxes in the filter ...
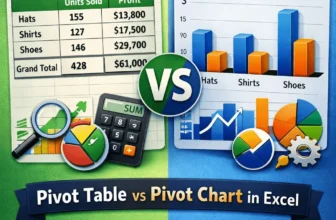
We use pivot tables to analyze and summarize large datasets while using pivot charts to visualize that summary.Suppose you want to check monthly sales by region of a store. You can make a pivot ...
When we analyze large datasets in Excel, we usually use pivot tables to summarize and analyze data. However, one common issue we face is that these tables do not update automatically when our source ...
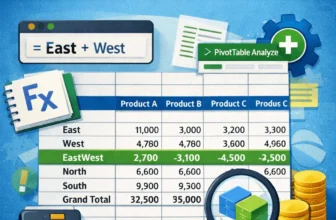
When we try to analyze large datasets in Excel, pivot tables help us to summarize and analyze information quickly. However, there are situations where the built-in fields and totals are not enough. ...
When we work with large datasets, including various categories in Excel, we often need to count the values of different categories that meet certain conditions only. In such cases, a simple count in ...
We often work with large datasets in Excel and use PivotTables to summarize and analyze our data quickly. However, most of the times, these datasets changes periodically. Or, sometimes, we need to ...
When we work with large datasets in Excel, we often need a quick way to filter and analyze information visually. In such cases, using slicers is the most common way. However, usually, we insert a ...
In Excel, pivot tables can be used to accomplish a lot of things. As pivot tables do their own calculations automatically, if we want to make a change and add more formulas, we have to do it using ...