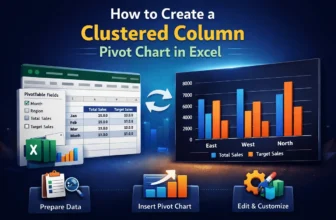
Visualizing data is crucial for better analysis, and a clustered column Pivot Chart is one of the best charts for it. It is a type of bar chart that displays data in vertical columns, where related ...
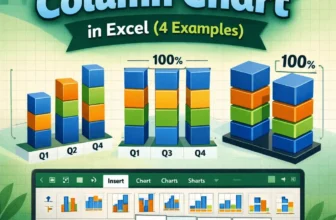
A stacked column chart allows for the comparison of components of a whole across different categories. Instead of showing separate bars, it stacks the values on top of each other, making it easy to ...
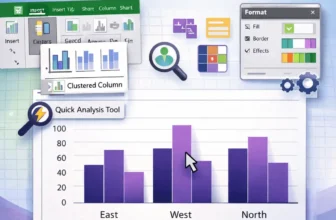
One of the most popular chart styles in Microsoft Excel is the clustered column chart, which is ideal for comparing results across several categories. For ease of comparison, vertical bars are ...