When planning your finances or evaluating business strategies, it is often helpful to test how two changing factors impact your outcome. That is where a two-variable data table in Excel becomes useful. It allows you to analyze how different combinations of two inputs, like interest rate and monthly deposit, affect a result, such as total savings or profit. In this tutorial, we will guide you through how to create a two-variable data table in Excel using a practical example.
To create a two-variable data table in Excel, follow the steps below.
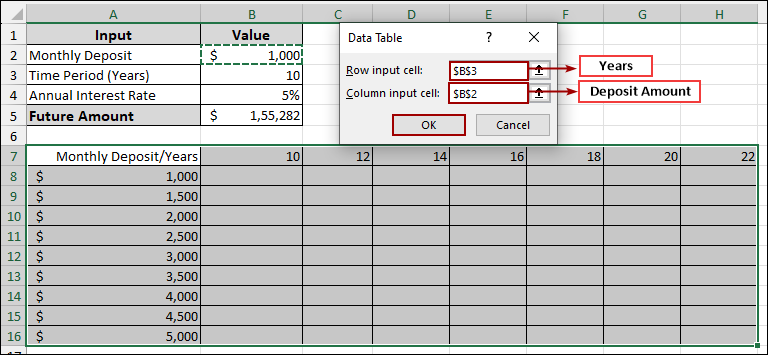
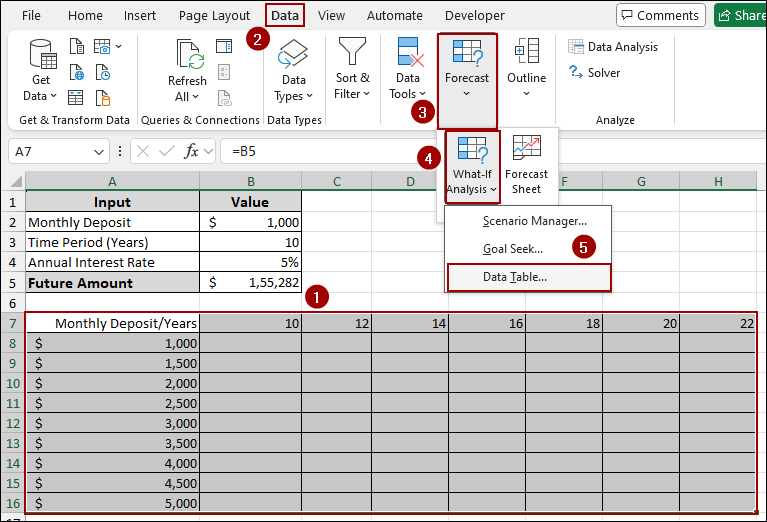
➤ Go to the Data tab, click What-If Analysis, and choose Data Table.
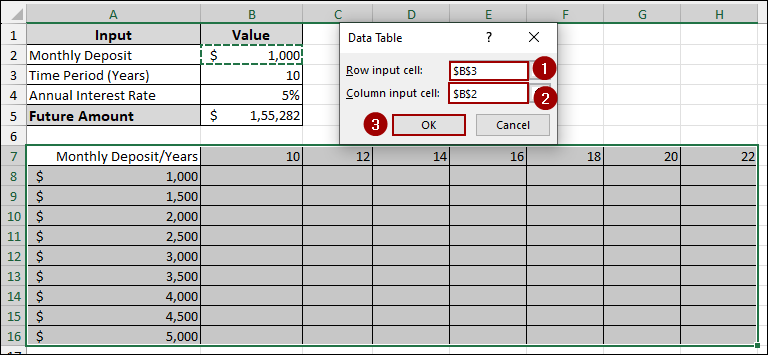
➤ In the Data Table dialog box:
➤ In the Row input cell field, choose years (cell B3), and in the Column input cell, select B2, since the column varies Deposit Amount.
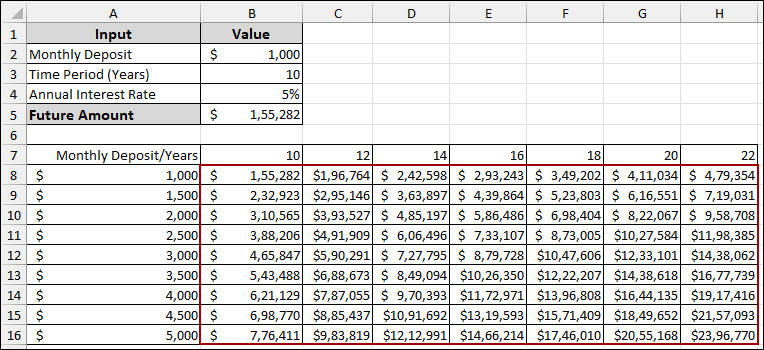
➤ Press OK. Excel will automatically calculate the Future Amount for each combination of monthly deposit and time period (in years).
What is Two Variable Data Table in Excel?
A two-variable data table in Excel is a built-in tool used for what-if analysis. It allows you to change two input values, such as interest rate and monthly deposit, and see how they affect a single result. Excel creates a structured table where all combinations of the two inputs are tested automatically. This helps you compare multiple scenarios at once without editing your formulas. Two-variable data tables are especially useful in financial planning, investment analysis, and business forecasting, where the outcome depends on more than one factor.
Steps to Create Two Variable Data Table
A two-variable data table lets you test multiple combinations of two inputs in Excel. It shows how those changes impact a single output, all in one dynamic table.
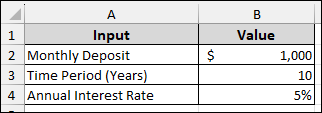
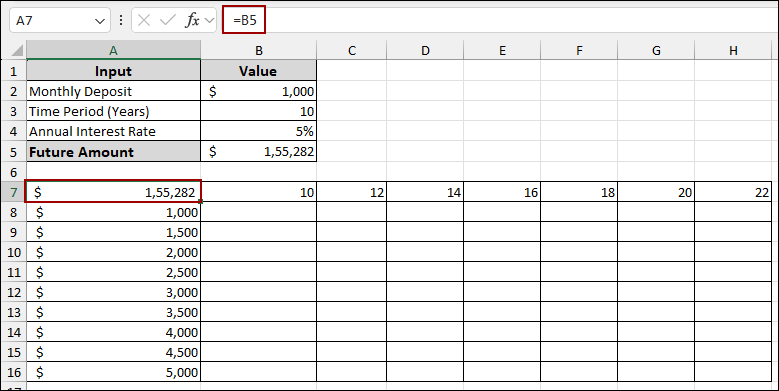
Suppose we have a dataset containing Monthly Deposit: $1,000, Time Period (Years): 10, Annual Interest Rate: 5%. Now we will calculate the future amount and then use a two-variable data table to see how it changes with different monthly deposits and time periods.
Step 1: Calculating Future Amount
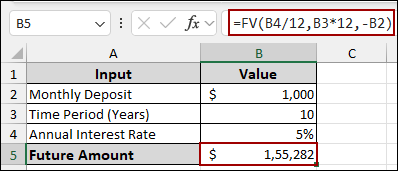
In this first step, we will calculate the Future Amount using Excel’s built-in FV function.
➤ In cell B5, write down the following formula.
=FV(B4/12,B3*12,-B2)
This formula takes into account the monthly interest rate, total number of payments, and the monthly deposit.
Step 2: Creating Data Table Range
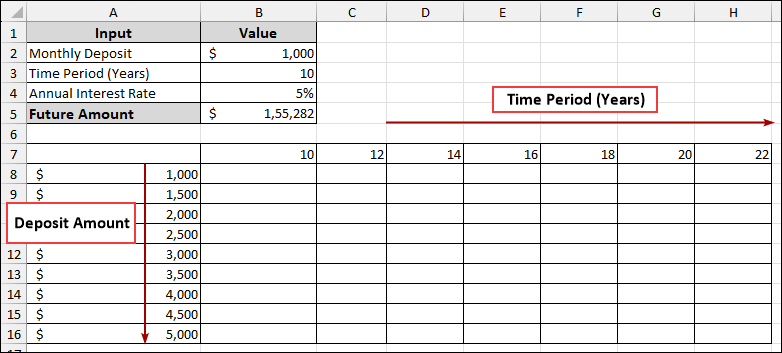
Here, we will analyze the Future Amount across different Monthly Deposits and Time Periods, setting up a two-variable data table.
➤ In the range B7:H7, enter the different Time Periods (Years) you want to analyze, for example, 10, 12, 14, 16, 18, 20, 22.
➤ In the range A8:A16, enter the different Monthly Deposit amounts you want to analyze, for example, from $1,000 to $5,000 in increments of $500.
➤ In cell A7, put the formula below.
=B5
This links the Future Amount calculation to the corner of our data table.
In order to make the data table header more informative and hide the linking amount, we will apply a custom number format.
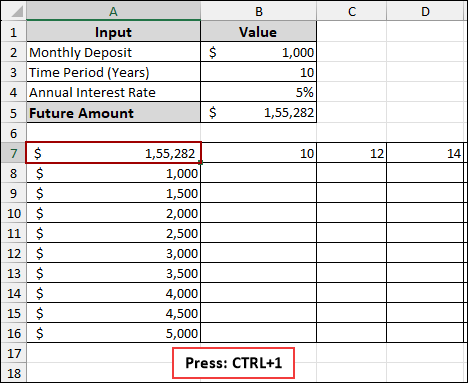
➤ Select cell A7.
➤ Press Ctrl + 1 on your keyboard to open the Format Cells dialog box.
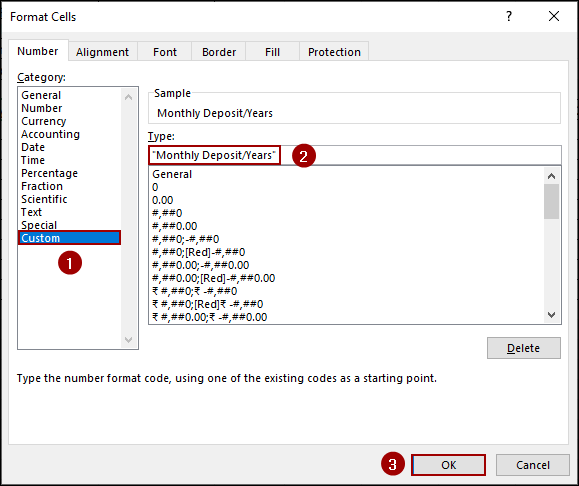
➤ Under the Number tab, choose Custom from the category list.
➤ In the Type field, enter “Monthly Deposit/Years”.
➤ Click OK.
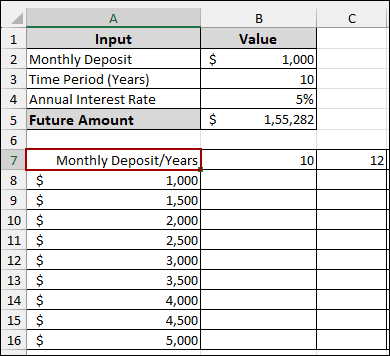
Thus, we will get a clear header for your two-variable data table.
Step 3: Applying Data Table Tool
In this final step, we will use Excel’s Data Table feature to populate it with Future Amount values based on varying Monthly Deposits and Periods.
➤ Select the entire range of your data table, which spans from A7 to H16.
➤ Go to the Data tab in the Excel ribbon.
➤ In the Forecast group, click on What-If Analysis.
➤ From the dropdown menu, select Data Table.
The Data Table dialog box will appear.
➤ In the Row input cell field, select cell B3 (the original Time Period (Years) input).
➤ In the Column input cell field, select cell B2 (the original Monthly Deposit input).
➤ Click OK.
As a result, your data table will be automatically filled with the Future Amount calculations for every combination of Monthly Deposit and Time Period.
Frequently Asked Questions
What’s the difference between one-variable and two-variable data tables?
A one-variable data table changes a single input value and shows how it affects the output, while a two-variable data table tests combinations of two inputs against one result.
Why is my two-variable data table showing the same value in all cells?
This usually happens when your formula doesn’t correctly reference the input cells, or if calculation mode is set to manual. Double check your references and ensure calculations are set to automatic.
Is it possible to use text values in a two-variable data table?
No, two-variable data tables only work with numeric inputs. The formula needs to calculate numerical results for the table to populate correctly.
Concluding Words
Above, we have explored how to create and use a two-variable data table in Excel to analyze how different combinations of inputs affect a single outcome. This method is especially useful when you want to compare results across multiple scenarios at once. Whether you’re forecasting savings, evaluating pricing models, or planning investments, two-variable data tables help you make more informed decisions. If you have any questions, feel free to leave them in the comments below.