One of the most useful statistical tests for examining the effects of two independent categorical variable on a single continuous dependent variable is the two way ANOVA. It enables you to assess each variable’s primary effects and identify any interactions between them. In this article, you will learn about two way ANOVA and how to do two way ANOVA in Excel. You will learn to conduct the test for both with replication and without replication conditions, analyze the results, and draw useful conclusions.
➤ Two way ANOVA determines the effect of two independent categorical factors on a continuous dependent variable. In this article, we’ll learn about the two way ANOVA test (with and without replication) using the Data Analysis ToolPak and how to interpret the two way ANOVA test results.
➤ Enable Data Analysis: File >> Options >> Excel Add-ins >> Data Analysis.
➤ With Replication: Data tab >> Data Analysis >> ANOVA: Two Way With Replication>> Input range >> Rows per sample >> Significance level >> Output range >> OK.
➤ Without Replication: Data tab >> Data Analysis >> ANOVA: Two Way Without Replication>> Input range >> Labels >> Significance level >> Output range >> OK.
➤ If F statistic > F critical, reject the null hypothesis and vice versa.
➤ If the P value < significance level, reject the null hypothesis and vice versa.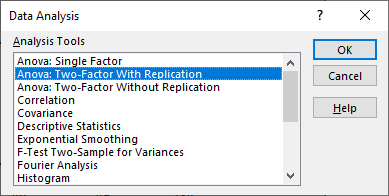
What is Two Way ANOVA?
A two way ANOVA determines the effect of two independent categorical factors on a continuous dependent variable. It assesses:
- The individual impact of each factor on the dependent variable.
- Whether the effect of one factor depends on the other factor.
The two way ANOVA test has the following hypotheses:
- Null hypothesis 1: The means of observations grouped by one factor are the same, that is, there is no difference in the daily, alternate days, and weekly water frequency.
- Alternate hypothesis 1: There is a difference in the means.
- Null hypothesis 2: The means of observations grouped by the second factor are the same, in other words, there is no difference in the fertilizers A, B, and C.
- Alternate hypothesis 2: There is a difference between at least two of them.
- Null hypothesis 3: There is no interaction between the two factors, i.e. the effect of fertilizer is not dependent on the water frequency.
- Alternate hypothesis 3: There is an interaction.
Two Way ANOVA with Replication
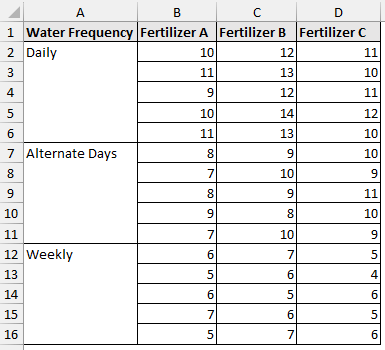
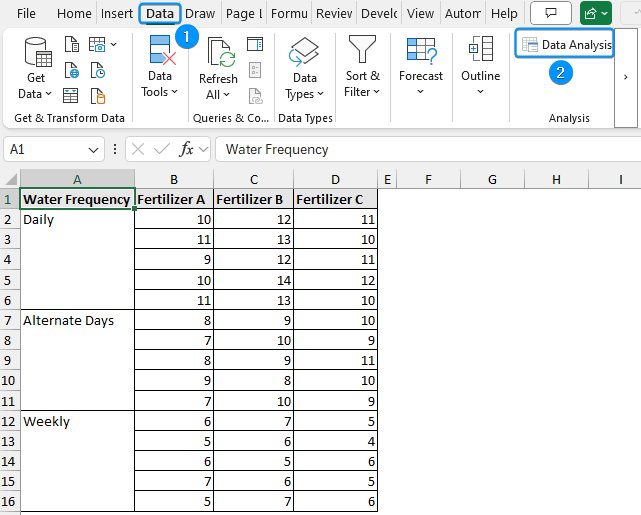
This dataset examines the effect of two factors i.e., water frequency and fertilizer type, on plant growth (in cm). For each combination of water frequency and fertilizer type, five observations were recorded.
You must enable the Data Analysis Toolpak to perform the two way ANOVA test. You’ll find this option in the Data tab. If not, follow these steps:
Steps:
➤ Click on the File tab.
➤ Select Options. You can also use the shortcut Alt + F + T to open Excel Options.

➤ Select Add-ins >> Choose Excel Add-ins from the dropdown >> Go.
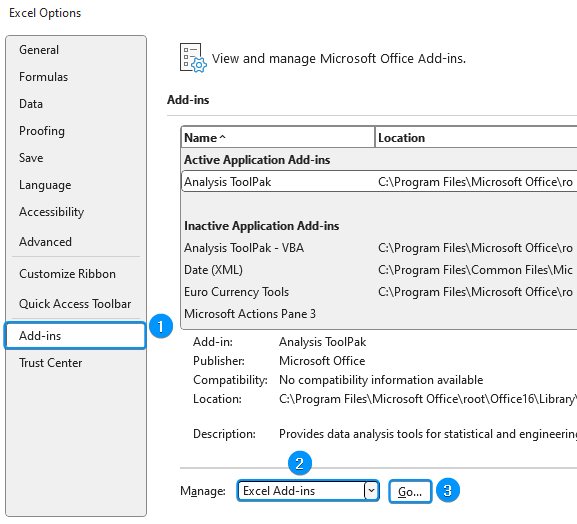
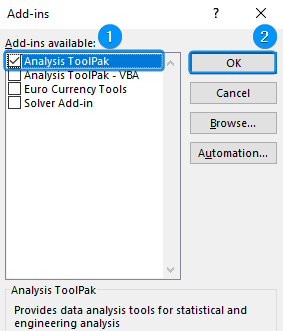
➤ Check the Analysis ToolPak option >> OK.
The Data Analysis ToolPak will be available in the Data tab whenever you open a new workbook.
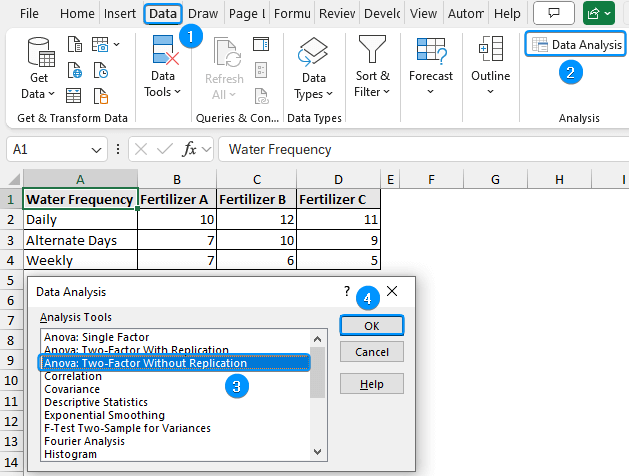
➤ Go to the Data tab >> Click Data Analysis.
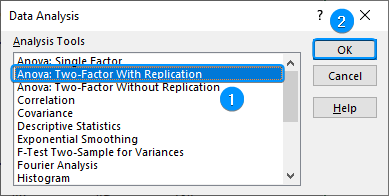
➤ Select ANOVA: Two-Factor With Replication >> OK.
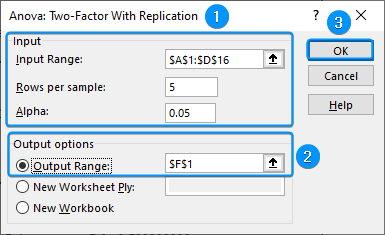
➤ Select the input range (A1:D16).
➤ Rows per Sample: 5 (since there are 5 observations for each combination of water frequency and fertilizer).
➤ Keep the default significance level (Alpha: 0.05).
➤ Choose the output cell (F1) >> OK.
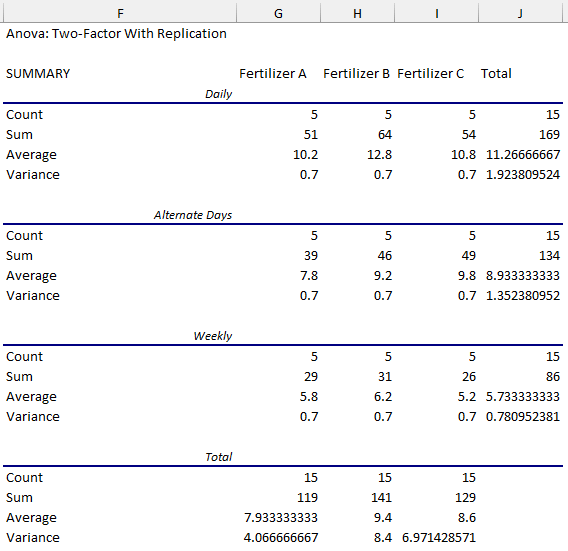
➤ The first four tables show the summary statistics. For example, the average height of plants watered on alternate days and treated with fertilizer B was 9.2cm, and so on.
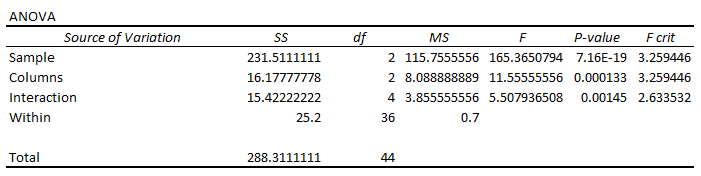
The table at the bottom shows the two way ANOVA results.
➤ The Sample row represents the water frequencies: daily, alternate days, and weekly.
- The F statistic is greater than the F critical value (165.3650794 > 3.259446).
- The P value is also less than the significance level (7.16E-19<0.05).
- So reject the null hypothesis (means of water frequencies are the same) and accept the alternative hypothesis that they are different.
➤ The Columns row shows the fertilizers A, B, and C.
- The F statistic exceeds the F critical value (11.55555556 > 3.259446).
- The P value is less than the significance level (0.000133<0.05).
- Therefore reject the null hypothesis (means of fertilizers are the same) and accept the alternative hypothesis that there is a difference between at least two factors.
➤ For the Interaction row:
- The F statistic is greater than the F critical value (5.507936508> 2.633532).
- The P value is less than the significance level (0.00145<0.05).
- Reject the null hypothesis (no interaction between water frequency and fertilizer) and accept the alternative hypothesis that there is an interaction between them.
- The growth of plants is dependent on the water frequency and fertilizer used.
Two Way ANOVA Without Replication
Similarly, let’s perform the two way ANOVA test without replication. Here, without replication means taking one sample for each condition.
Steps:
➤ Data tab >> Data Analysis >> ANOVA: Two-Factor Without Replication >> OK.
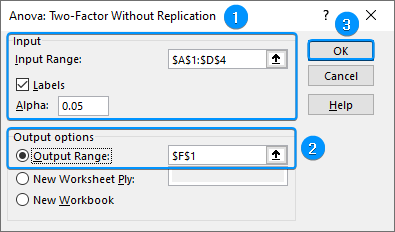
➤ Select the input range (A1:D4) >> Check the Labels option >> The significance level (Alpha: 0.05) >> Output cell (F1) >> OK.
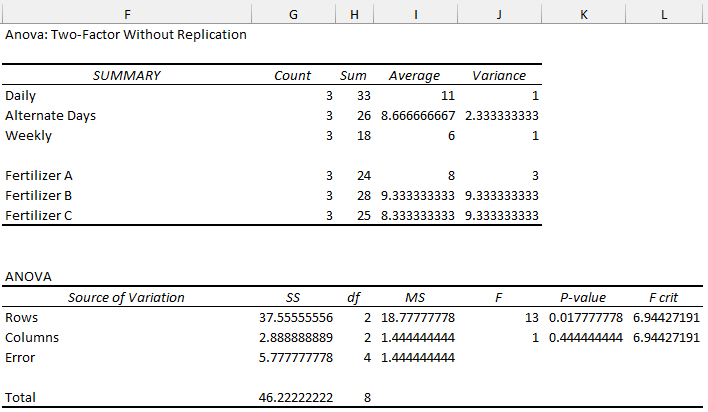
➤ The first table shows the summary statistics, while the second table gives the results of the two way ANOVA test without replication.
➤ For the Rows, the F statistic is greater than the F critical value and the P value is less than the significance level. So reject the null hypothesis and accept the alternative hypothesis that means of water frequencies are different.
➤ For the Columns, the F statistic is less than the F critical value and the P value is greater than the significance level. So we fail to reject the null hypothesis that the means of fertilizers are the same.
Frequently Asked Questions
When to use the two way ANOVA test?
- Effect of two independent categorical factors on one dependent continuous variable.
- Examining the main effect (if each factor independently affects the dependent variable) and interaction effect (the effect of one factor depends on the other).
- Data replication (multiple observations for each set of factors)
How to perform a two way ANOVA test in Excel?
- Enable Data Analysis: File >> Options >> Excel Add-ins >> Data Analysis.
- With Replication: Data tab >> Data Analysis >> ANOVA: Two Way With Replication >> Input range >> Rows per sample >> Significance level >> Output range >> OK.
- Without Replication: Data tab >> Data Analysis >> ANOVA: Two Way Without Replication >> Input range >> Labels >> Significance level >> Output range >> OK.
How to read two way ANOVA test results?
Check the F statistic:
- If F statistic > F critical, reject the null hypothesis.
- If F statistic < F critical, cannot reject the null hypothesis.
Check the P value:
- If the P value < significance level, reject the null hypothesis.
- If the P value > significance level, cannot reject the null hypothesis.
How do I set up my data for two way ANOVA in Excel?
- Place the independent categorical factors along the rows and columns.
- The cells within this table should contain the dependent continuous data.
- There may or may not be replications for each set of combinations of the two factors.
Wrapping Up
In this tutorial, we’ve learned the two way ANOVA test in Excel: with replication and without replication. We’ve also discussed the test results and their significance. Feel free to download the practice file and let us know which method you like the most.