Demographers, economists, and policymakers need to understand the population growth rate because it helps them plan for the future and shows how quickly a country’s population is growing. In this article, you will learn how to calculate population growth rate in Excel. In addition, you will learn to use population projection formulas for linear, geometric, and exponential methods.
➤ Population growth rate is the change in population over time. ➤ CAGR: In this article, we’ll learn about population growth rate and how to calculate population growth rate in Excel using AAGR and CAGR. In addition, we’ll also learn linear, geometric, and exponential population projection formulas in Excel.
➤ AAGR:=new/old-1=AVERAGE(cell range containing the annual growth rates)=(end value/starting value)^(1/period) -1
➤ Linear projection: =Base year population+Average change*Projected period
➤ Geometric projection: =Base year population*(1+Average growth rate)^Projection period
➤ Exponential projection: =Base year population*e^(Average growth rate*Projection period)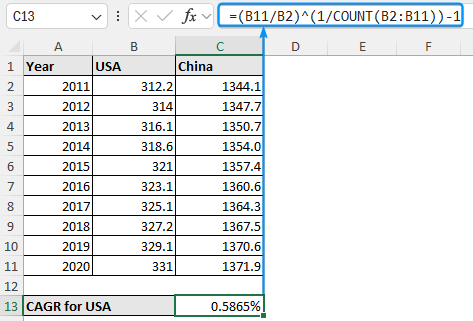
Calculating Average Annual Growth Rate in Excel
An easy way to figure out how much the population grows each year over a certain time period is to look at the Average Annual Growth Rate (AAGR). It gives a brief overview of growth trends and is simple to calculate.
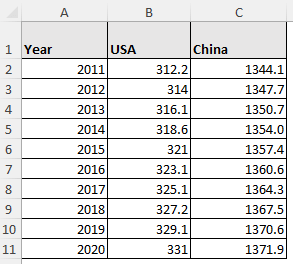
Consider the population data (in millions) for the USA and China from 2011 to 2020 in columns A through C.
For example, we can calculate and compare the average annual growth rate and compound annual growth rate for the USA and China.
Steps:
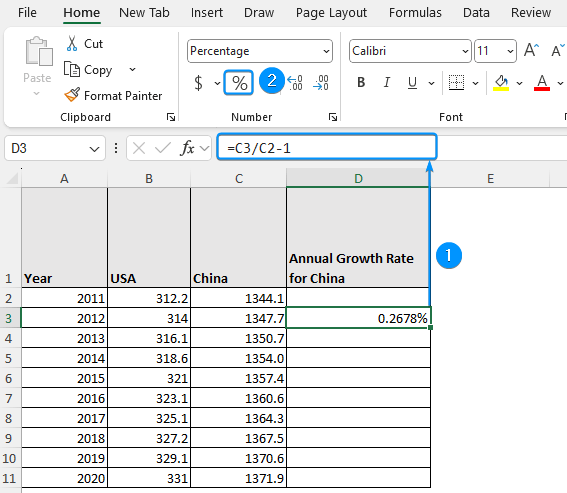
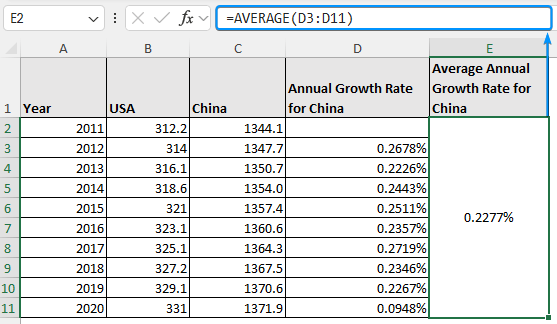
➤ Move to cell D3 >> Enter the formula below to calculate the annual growth rate for China >> Apply percentage formatting.
=C3/C2-1
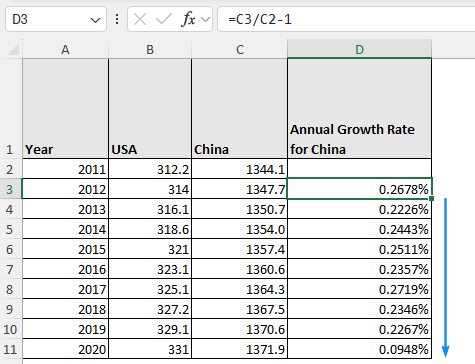
➤ Use the Fill Handle tool to copy the formula to the cells below.
➤ Use the AVERAGE function to find the average annual growth rate for China between 2011 and 2020.
=AVERAGE(D3:D11)
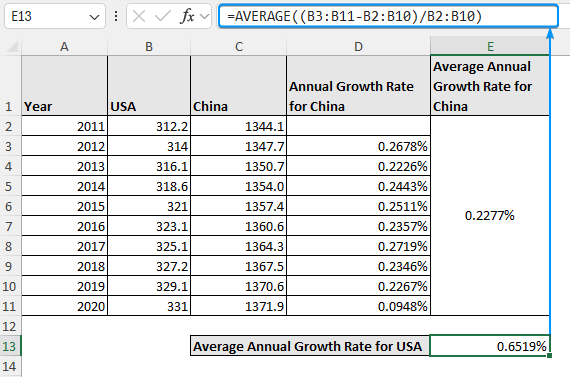
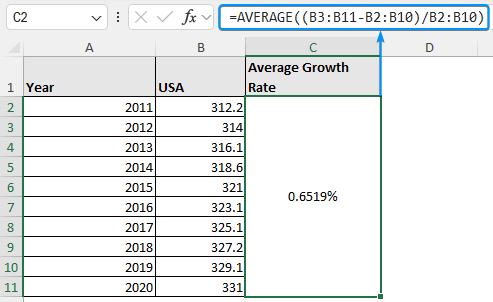
➤ Use this formula to directly calculate the average annual growth rate without creating a helper column.
=AVERAGE((B3:B11-B2:B10)/B2:B10)
Calculating Compound Annual Growth Rate of Population in Excel
The compound annual growth rate (CAGR) shows the smoothed annual growth rate between the beginning and ending populations and accounts for the compounding effect. CAGR is more accurate for long term population studies.
Steps:
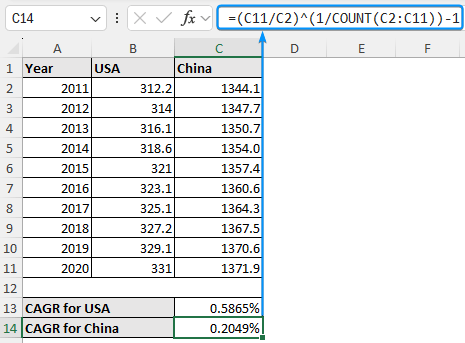
➤ Enter this formula in cell C13 to calculate the CAGR for the USA.
=(B11/B2)^(1/COUNT(B2:B11))-1

➤ In a similar way, calculate the CAGR for China
=(C11/C2)^(1/COUNT(C2:C11))-1
Population Projection Formula in Excel
Population projection forecasts the population’s size based on historical growth patterns. You can use various Excel formulas and functions for projecting the population.
Linear Projection Formula in Excel
A linear projection assumes the population will increase by a certain amount every year. Linear projection is suitable when population growth exhibits a consistent and predictable pattern.
Steps:
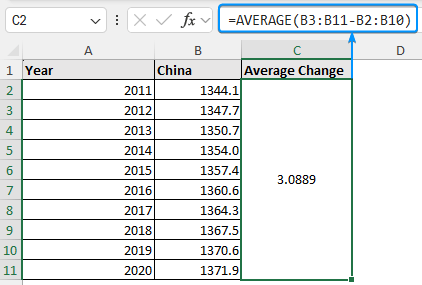
➤ Go to cell C2 and calculate the average population change. For Excel 365, just press Enter . For earlier versions of Excel, press Ctrl + Shift + Enter .
=AVERAGE(B3:B11-B2:B10)
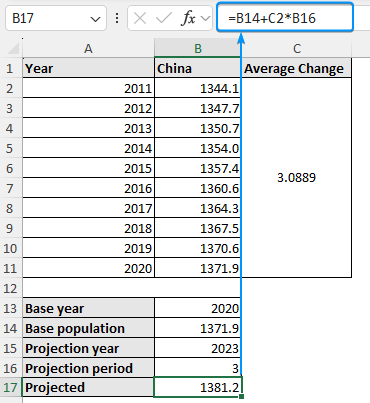
➤ The generalized linear projection formula is:
Projected population = Base year population + Average change × Projected period
➤ Enter this formula in cell B17 to project the population of China in 2023.
=B14+C2*B16
Geometric Projection Formula in Excel
Geometric projection assumes the population will increase at a steady percentage rate. It can be used to simulate consistent proportional growth over time.
Steps:
➤ Move to cell C2 and calculate the average growth rate.
=AVERAGE((B3:B11-B2:B10)/B2:B10)
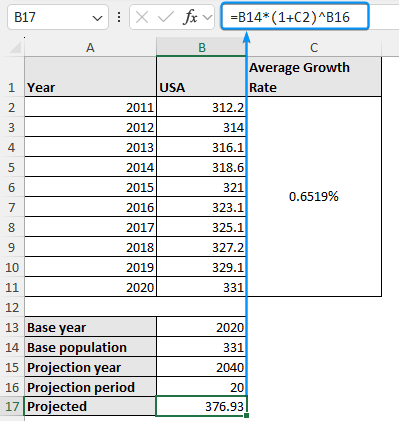
➤ The generic formula for geometric projection is:
Projected population = Base year population × (1+Average growth rate))^Projection period
➤ Suppose we want to project the population of the USA in 2040.
=B14*(1+C2)^B16
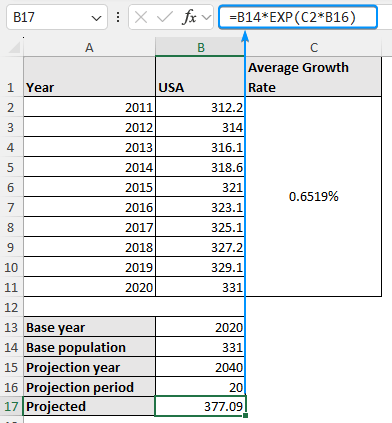
Exponential Projection Formula in Excel
Exponential projection portrays a rapid population change when growth accelerates over time. It is useful when growth rates are continuously high.
Steps:
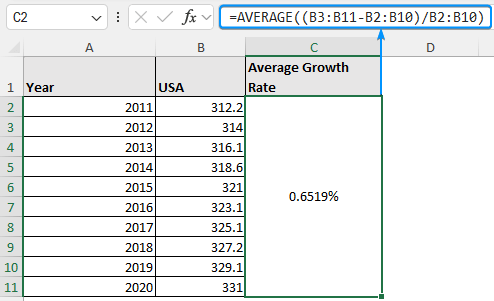
➤ Calculate the average growth rate. For Excel 365, just press Enter . For earlier versions of Excel, press Ctrl + Shift + Enter .
=AVERAGE((B3:B11-B2:B10)/B2:B10)
➤ The general expression for exponential projection is:
Projected population = Base year population × e^(Average growth rate*Projection period)
➤ The projected population for the USA in 2040, based on the exponential projection model, is
=B14*EXP(C2*B16)
Frequently Asked Questions
What is population growth rate, and why is it important?
Population growth rate is the percentage change in population over a specific period. It gives an idea of whether a population is increasing or decreasing. This is important for government planning, economic analysis, etc.
AAGR vs. CAGR
AAGR is a simple annual average. In contrast, CAGR is accounts for compounding and is more accurate for long term analysis.
How to calculate CAGR in Excel?
CAGR: =(end value/starting value)^(1/period) -1
Which is the best project method?
- Linear projection: for a steady growth rate.
- Geometric projection: for a steady percentage rate.
- Exponential projection: for a rapid change in growth rate.
Why do the results of the projection model differ slightly?
Because various growth types are assumed by each projection model (steady vs. steady percentage vs. rapid increase).
Wrapping Up
In this tutorial, we’ve learned how to calculate population growth rate in Excel using AAGR and CAGR. Additionally, we’ve also learned to apply the linear, geometric, and exponential population projection formulas in Excel. Feel free to download the practice file and share your thoughts and suggestions.