Summary statistics (aka descriptive statistics) gives a statistical description of the properties of a dataset. Excel offers built-in Data Analysis software to get the summary statistics quickly.
To get summary statistics in Excel, follow the steps below:
➤ Enable Data Analysis: File >> Options >> Excel Add-ins >> Data Analysis.
➤ Get summary statistics: Data tab >> Data Analysis >> Descriptive Statistics >> Input Range >> Output Range >> Summary statistics.
➤ Summary statistics describe the various properties of a dataset.
In this article, we will obtain the descriptive statistics using the Data Analysis add-in. This allows us to understand the values in the dataset better, and compare variables, projects, etc.
Quick Video Tutorial: Get Summary Statistics in Excel
Enabling Data Analysis ToolPak
We need to enable the Data Analysis Toolpak to get the summary statistics. You’ll find this option in the Data tab. If not, follow these steps:
Steps:
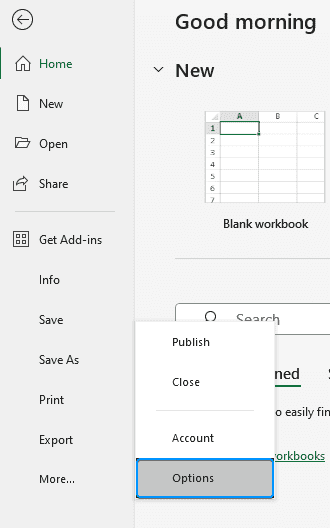
➤ Click on the File tab.
➤ Select Options. You can also use the shortcut Alt+F+T to open Excel Options.
➤ Select Add-ins >> Choose Excel Add-ins from the dropdown >> Go.
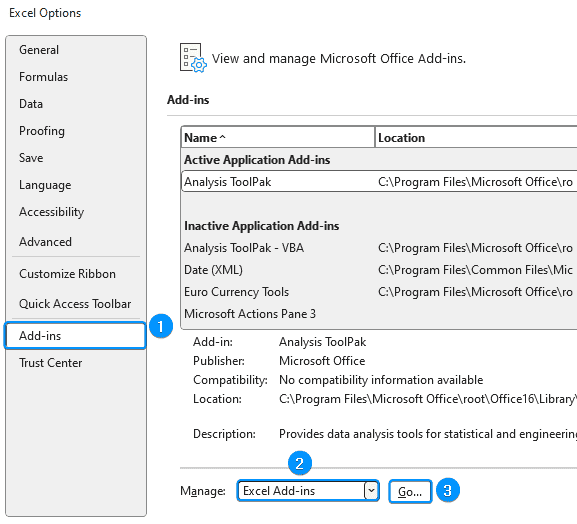
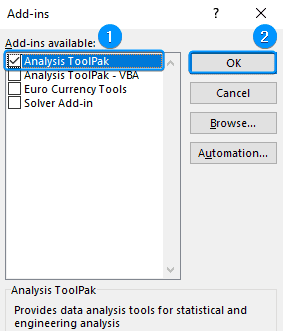
➤ Check the Analysis ToolPak option >> OK.
The Data Analysis ToolPak will be available in the Data tab whenever you open a new workbook.
Getting Summary Statistics
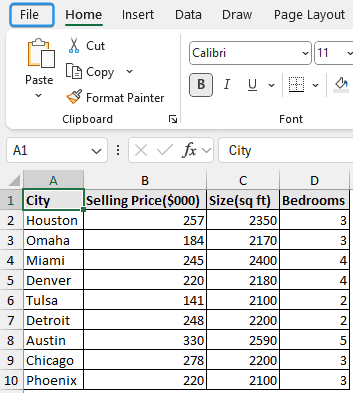
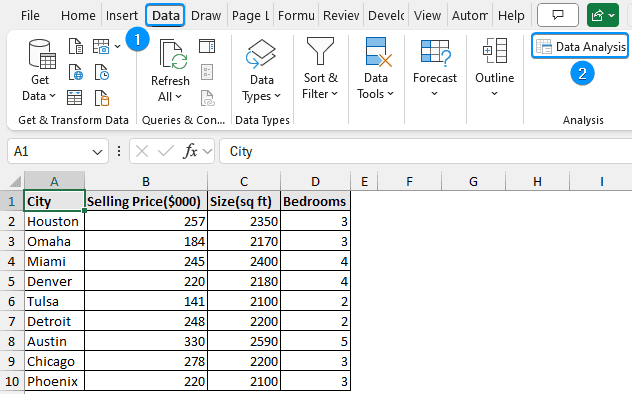
In the following dataset, we have the city name in Column A, the selling price in Column B, size in Column C, and number of bedrooms in Column D. We will get the summary statistics for the selling price, size, and number of bedrooms with the Data Analysis software activated earlier.
Steps:
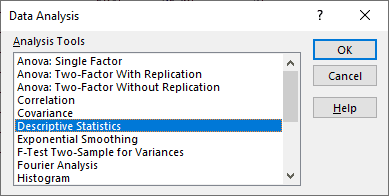
➤ Go to the Data tab >> Click Data Analysis.
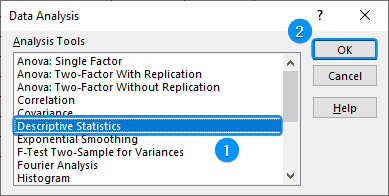
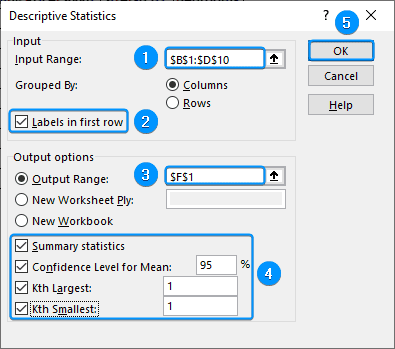
➤ Select Descriptive Statistics >> OK.
➤ Select the input range (B1:D10) >> Tick the option “Labels in first row”.
➤ Choose the output cell (F1) >> Check at least one or all the options.
Explanation of All the Options:
| Options | Explanation |
|---|---|
| Input Range | Select the range you want to analyze. Your range can have a single or multiple variable. The data must be contiguous for multiple variables |
| Grouped By | Choose row or column according to how your is organized |
| Labels in first row | Enable this option if the first row contains labels |
| Output options | Select the output range to get the results in the same worksheet. Also, you can get the results in a new worksheet or a new workbook |
| Summary statistics | Gives the descriptive statistics of the data |
| Confidence Level for Mean | Displays the likely mean value. A 95% confidence level is a good choice |
| Kth Largest and Kth Smallest | Shows the highest and lowest values. The default value is 1, if you enter 2 it’ll give the second highest and lowest values |
➤ You’ll get the results as shown below.
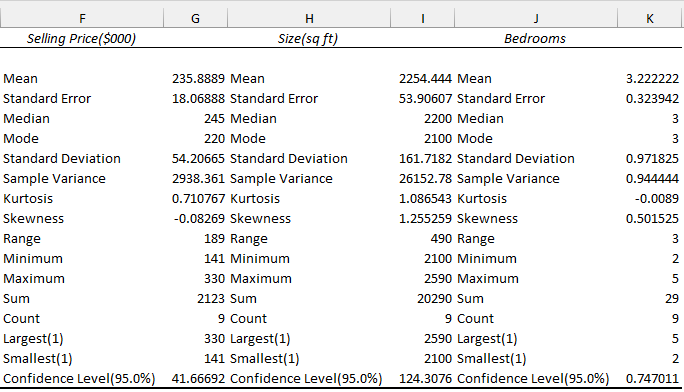
Explanation of the Results:
| Terms | Explanation |
|---|---|
| Mean | Gives the central value in the data |
| Standard Error | Represents the standard deviation of the sampling distribution |
| Median | Half of the values are above the median value and half of the values are below the median value |
| Mode | The most frequently occurring value |
| Standard Deviation | Measures how far apart the values are in the data |
| Sample Variance | Shows the average difference of the values from the mean |
| Kurtosis | Indicates how much the head and tail distribution of the data differs from the normal distribution |
| Skewness | Indicates the symmetry of the distribution |
| Range | Difference between the highest and lowest values in the data |
| Minimum | Shows the minimum values in the dataset |
| Maximum | Shows the maximum values in the dataset |
| Sum | Gives the summation of the values |
| Count | Counts the number of values |
| Largest | Shows the Kth largest number |
| Smallest | Shows the Kth smallest number |
| Confidence Level | Gives the likely mean value |
FAQ
What is Descriptive Statistics?
Descriptive statistics gives a summary and describes the properties of a dataset. This description is based on:
➤ Central tendency (mean, median, mode).
➤ Variation of the data (variance, standard deviation, skewness, kurtosis).
➤ Frequency of the distribution (count).
How to get the summary of data in Excel?
To get a basic summary, select the numeric data and Excel will display the sum, average, and count of the data in the Status Bar.
Why summary statistics is not working?
You may get an error if you don’t choose at least one of these options: Summary statistics, Confidence Level for Mean, Kth Largest, and Kth Smallest.
Wrapping Up
In this quick tutorial, we’ve learned to enable the Data Analysis ToolPak and to get the summary statistics. We’ve covered the details of each option and their function. Lastly, we’ve explained the results and their significance. Feel free to download the practice file and share your experience.