A 95% confidence interval means – 95% of the standard normal distribution lies between an interval bounded by two Z scores. To calculate Z score 95% confidence interval in Excel, you can use functions or the Z table.
➤ A 95% confidence interval means we are 95% confident that the true population parameter (like mean) lies within this range. In this article, we’ll learn about the confidence interval and two ways to calculate the Z scores. We’ll use the NORM.S.INV function and Z table to get the results.
➤ The tail area is represented by alpha. Alpha = 1 - confidence interval.
➤ Z score for 95% confidence interval: =-NORM.S.INV((1-confidence interval)/2).
➤ A 95% confidence interval Z score can be calculated from the Z table.
What is Z Score for a 95% Confidence Interval?
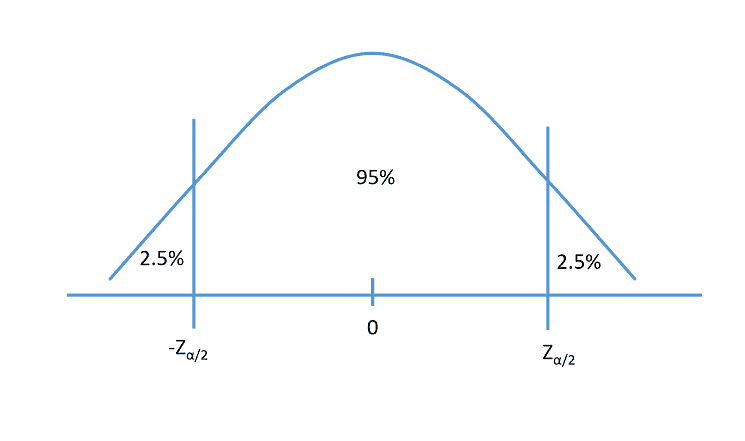
The standard normal distribution is centered on zero and the total area equals 1. A 95% confidence interval indicates that 95% of the standard normal distribution lies between two numbers. These two numbers are the Z scores we want to calculate.
The positive Z score is located to the right (above zero) while the negative Z score is to the left (below zero). The two Z scores are the same because the standard normal distribution is symmetric.
The tail area is represented by alpha. Since 95% is exactly in the center, the remaining tail area is 5% (1-0.95). This area is divided equally between the two tails which give 2.5% (5%/2) for each tail.
Let’s explore the methods to calculate the Z score 95% confidence interval in Excel.
Using NORM.S.INV Function to find Z score for 95% Confidence Interval
Excel’s NORM.S.INV function calculates the Z score for 95% confidence interval or any confidence interval. We only need to provide the tail area to get the result.
Steps:
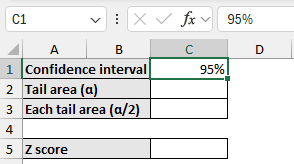
➤ Select the cell C1 and enter the confidence level (95%).
➤ Calculate the tail area by subtracting the confidence interval from 1.
=1-C1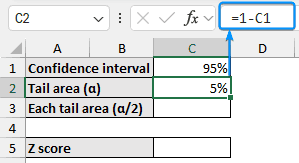
➤ This tail area is divided equally by the two tails so divide the tail area by 2.
=C2/2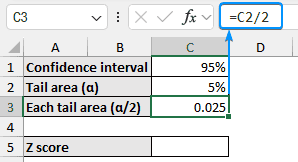
➤ Use the NORM.S.INV function to get the Z score of approximately 1.96. By default, Excel returns the negative left-tail value, so insert a negative sign to make it positive.
=-NORM.S.INV(C3)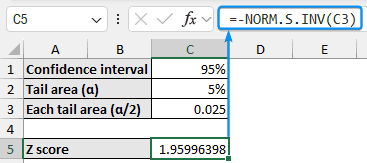
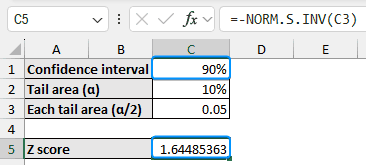
➤ Similarly, for a 90% confidence interval, the Z score is 1.64.
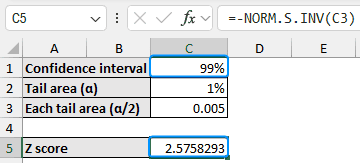
➤ We get a Z score of 2.58 for a 99% confidence interval.
You can calculate the Z score for any confidence interval, just change the value in cell C1.
Using Z Table to Get a Z Score from 95% Confidence Interval
You can also use the Z table to calculate the Z score for a given confidence interval.
Steps:
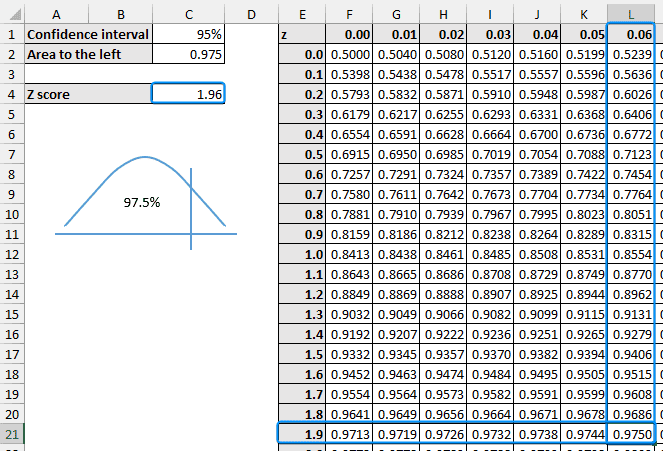
➤ Set a confidence interval (95%) in cell C1. Calculate the entire area to the left of the Z score.
=(1+C1)/2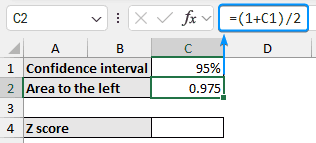
➤ In the Z table look for the value 0.975. The corresponding Z score at the intersection of the left column and top row is 1.96(1.9+0.06).
FAQ
How to calculate the Z score?
Arithmetic formula: z=(data point-mean)/standard deviation
Excel formula: =STANDARDIZE(data point,AVERAGE(cell range),STDEV.S(cell range))
What is the critical Z value or Z* value for constructing a 95% confidence interval?
The critical Z value (Z*) for a 95% confidence interval is 1.96. Use this Excel formula =-NORM.S.INV((1-confidence interval)/2) to calculate the critical Z score for any confidence interval.
What is the Z test formula for confidence interval?
If the sample size is greater than 30,
Confidence Interval = mean ± Zα/2(standard deviation/√sample size)
How to interpret a 95% confidence interval?
A 95% confidence interval means we are 95% confident that the true population parameter (like mean) lies within this range. For example, If the average height of students in a class has a 95% confidence interval of 44.41, 52.57, this means we are 95% confident that the true average height of all students in the class is between 44.41 and 52.57.
Wrapping Up
In this quick tutorial, we’ve learned about the confidence interval and how to get Z score 95% confidence interval in Excel using functions and the Z table. Feel free to download the practice file and let us know which method you like the most.