A timeline in a pivot table to filter the table using time-based data. When analyzing data for a specific time period, a timeline makes it easier to filter the table than using a slicer. Instead of selecting the fields like other filters, we can just drag a bar to select the dates. In this article, we will learn everything about a timeline in a pivot table. We will learn how to create a timeline, how to customize it, how to reset the filters, and more.
➤ Select a cell of the pivot table so that the pivot table-related tabs show up on the ribbon.
➤ Go to PivotTable Analyze tab.
➤ In the Filter section, select Insert Timeline.
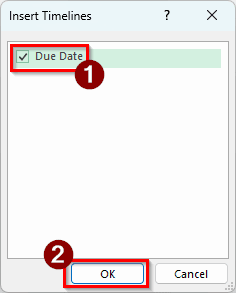
➤ Check the box(es) with dates and press OK to add the timeline.
You know how to create a timeline now. But to know how to customize it, fix issues when it does not work, and use it properly, you need to read the whole article. You can always jump to the required section if you are here for a specific tutorial.
Creating a Pivot Table Timeline in Excel
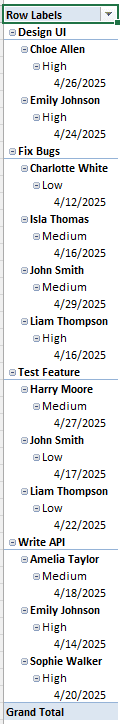
To demonstrate the timeline, we have a dataset with some project tasks related to programming. There are the task names, the programmers those tasks were assigned to, the priority of those tasks, and the due dates. We will use the timeline to filter the pivot table using the due dates. First, let’s learn how to create a pivot table timeline.
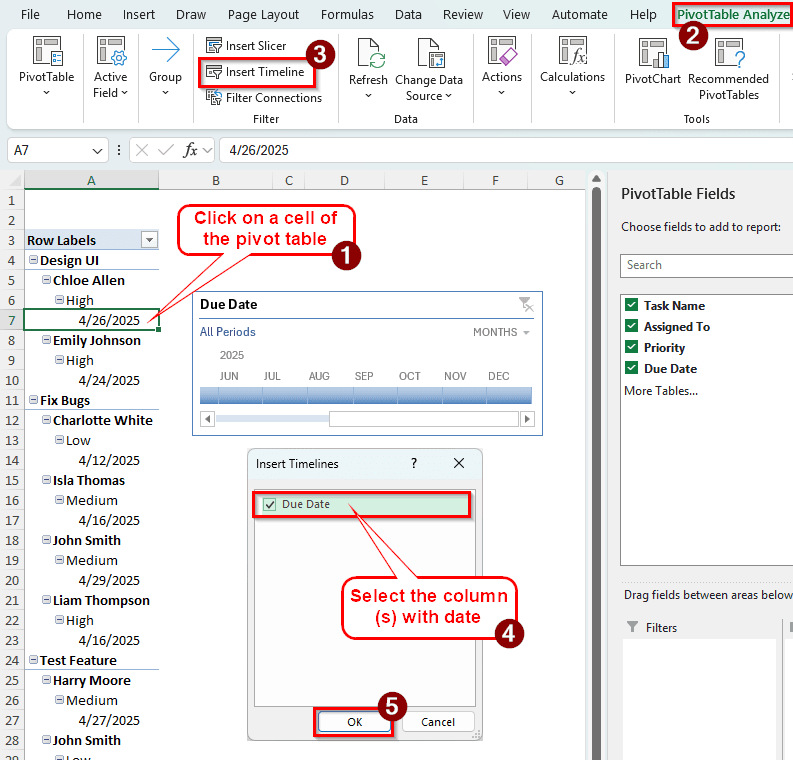
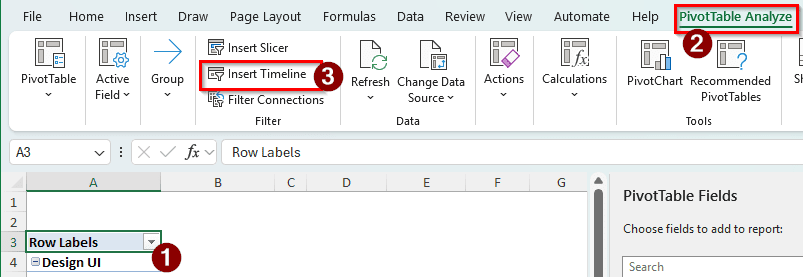
➤ Select a cell from the pivot table so that we can customize the table.
➤ From the ribbon at the top, go to PivotTable Analyze.
➤ In the Filter section, you will find the Insert Timeline button.
➤ A small tool window called Insert Timelines will pop up. Check the box on the left of Due Date and press OK.
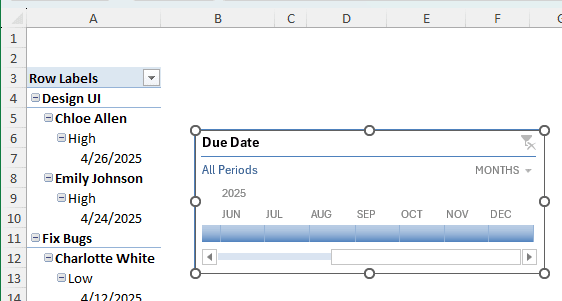
➤ Now, a timeline will show up in the worksheet.
Using the Pivot Table Timeline
Now that we have added the timeline, let’s learn how to use it. Check the steps below:
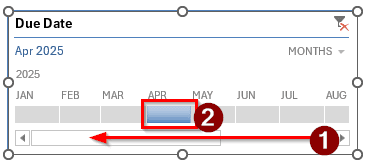
➤ Drag the slider of the timeline to the left and select APR to show its data only. This, however, makes no change to the pivot table because we only have dates from a single month, which is April.
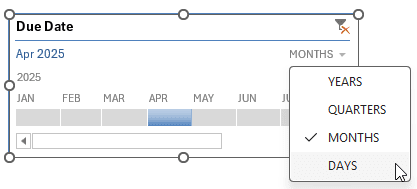
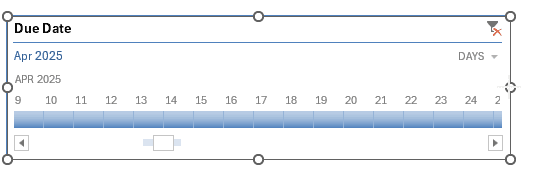
➤ Click on MONTHS on the top right of the timeline. We can change the timeline to YEARS, QUARTERS, MONTHS, and DAYS from here. Let’s select DAYS for now.
➤ Drag the corners of the timeline to make it bigger, as we cannot select the dates properly in the current form.
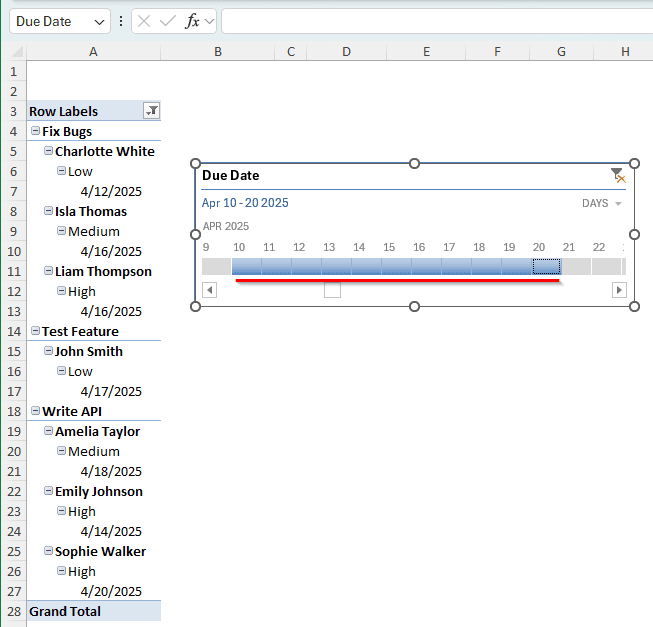
➤ Now select the 10 to 20 day markers using your mouse. Now we can see actual changes in the pivot table as only those dates will show up.
➤ Press the Clear Filter button on the top right or press Alt + C to clear the filter.
Customizing the Pivot Table Timeline
There are many ways to customize the timeline. We will go through all of them in this section.
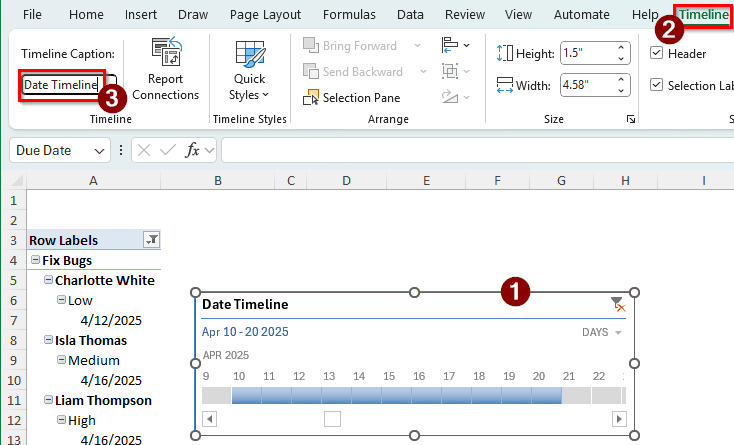
➤ Click on the timeline to enable the Timeline tab of the ribbon.
➤ Go to the Timeline tab. We now have a bunch of options to customize the timeline with.
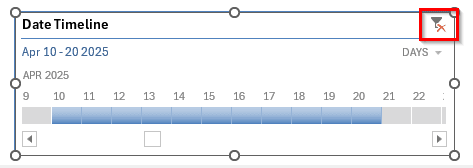
➤ Change the Timeline Caption to Date Timeline.
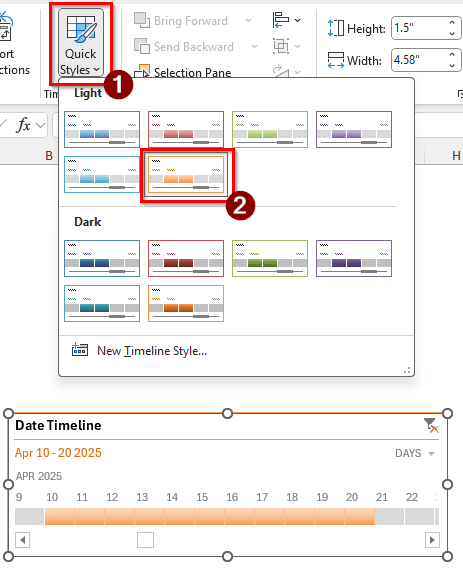
➤ Go to the Quick Styles and change the style of the timeline of the pivot table.
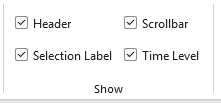
➤ There are more options in the Show section to show/remove the header, scrollbar, selection label, and time level.
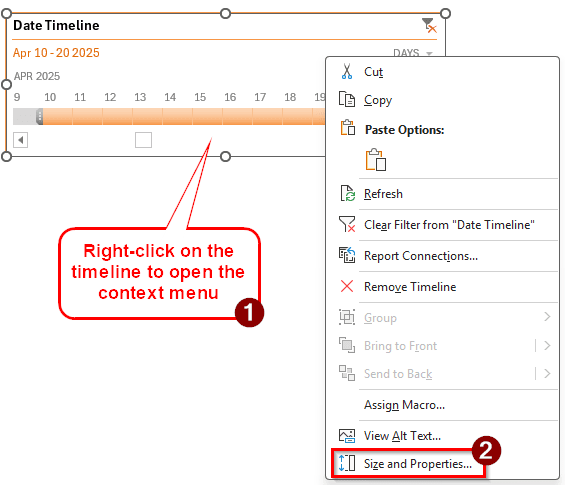
➤ We can access some more formatting options by right-clicking the timeline and selecting Size and Properties from the context menu.
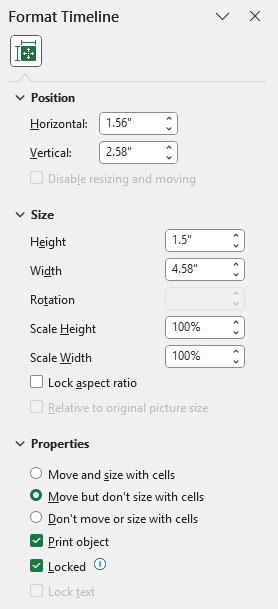
➤ We can change the position, size, and properties of the timeline from the panel that opens up.
Fixing Pivot Table Timeline Creation Error
Sometimes, when trying to create a timeline, Excel might show an error like below:
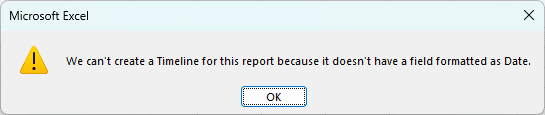
In that case, we need to follow the steps below:
➤ First, make sure that you have dates in the pivot table. If there are no dates in the pivot table, there is no timeline to make.
➤ Go to the source data, and find the column that has dates. Then, make sure the format of the cells is called Date in the Number section of the Home tab.
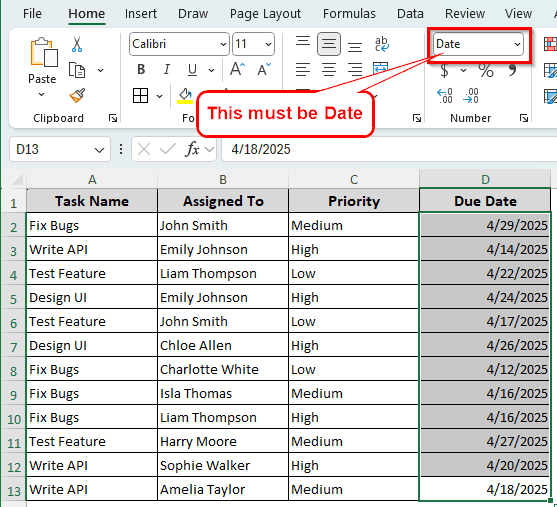
➤ If it’s not called Date, change it to Date and recreate the pivot table.
Connecting Multiple Pivot Tables to a Single Timeline
A single timeline can be used to connect multiple pivot tables. Here is how to do it:
➤ Make sure that the pivot tables you are trying to connect are either from a single dataset or have a relationship with DAX.
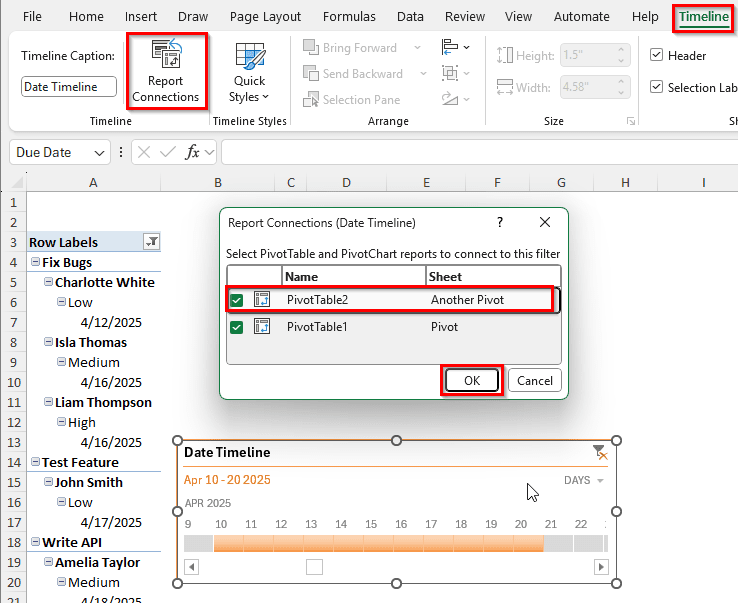
➤ To demonstrate this, we have created another pivot table with the same data in another sheet.
 ➤ Now, go to the Report Connections section of the Timeline tab in the ribbon.
➤ Check the boxes of the pivot tables that you want to include in the timeline.
➤ Press OK to confirm.
Frequently Asked Questions
What’s the difference between a PivotTable slicer and a timeline?
Slicer and timeline are both used to filter a pivot table, but they are very different. The most significant difference between a slicer and a timeline is that a slicer allows you to filter using any criteria, while a timeline only filters using dates. If your dataset does not include any fields with dates, you cannot use a timeline in the pivot table.
What are the four areas of a PivotTable?
The four areas of a pivot table are the Filters, Columns, Rows, and Values. You can move the fields in those areas freely to customize the pivot table as you want.
How to create a PivotTable to track data?
Select the data range you want to create the pivot table with. Then, from the ribbon at the top, go to the Insert tab. Click on the icon that says PivotTable in the Tables section. In the new window, select Add this data to the Data Model if you want to connect the pivot table to other pivot tables. You can change whether you want the pivot table in an existing range or in a new worksheet as well. Press OK to confirm.
How to create a timeline in Google Sheets?
In the top menu of the sheet, there should be a button called Insert. From there, click on timeline. Then, select the data range and hit OK to create the timeline. However, you need at least Google Workspace Essentials to create a timeline. A regular non-professional account might not work.
How to combine date and time in Excel?
Select the cells that you want to combine the date and time of. From the Home tab, go to the Number section, and select More Number Formats from the dropdown menu. In the left panel of the Number tab, find Date. Then, from the right panel, select a format that you like and one that accepts both date and time. Press OK to confirm.
Wrapping Up
In this article, we have learned how to create and manipulate a timeline in a pivot table. You now know the ins and outs of a timeline and can make one for your dataset. Don’t hesitate to download the Excel file we used in this article to play with timelines. See you again in a future article.