The hierarchy chart is a visual representation of a system where elements are organized according to importance, authority, or relationship levels. It helps users to clearly visualize team ...
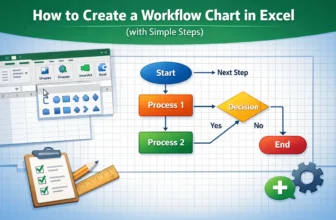
A workflow chart in Excel visually represents the sequence of steps in a process, making it easier to understand, analyze, and improve operations. With Excel’s built-in tools like Shapes, Connectors, ...
Flowcharts are excellent tools for illustrating workflows, processes, or decision-making steps in a visual format. While Excel isn’t specifically built for diagramming, it includes a wide range of ...
Excel is a great tool to use in a company or an organization to maintain staff information, reporting lines and defining roles. However, simply putting these data in a list does not suffice when it ...
Venn diagrams are perfect for visually showing overlaps, shared traits, and differences between datasets or categories. While Excel doesn't offer a built-in Venn diagram feature, you can still create ...