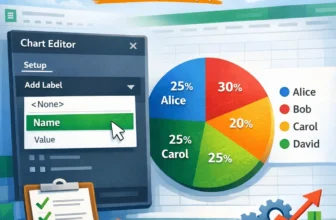
We need to label legends in Google Sheets to ensure that the viewers of our charts understand the insights clearly. Although charts in Google Sheets usually include a label legend, it may sometimes ...
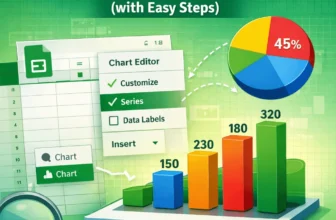
In Google Sheets, data labels are visual indicators on a chart that show the exact values of individual data points or data series. Whether you’re preparing reports or presenting results, data labels ...
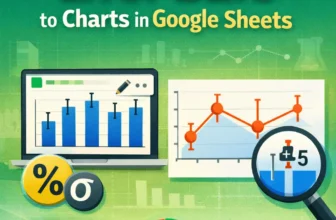
For data involving uncertainty, such as scientific experiments or survey results, error bars in charts visually represent the value range. Google Sheets allows you to add error bars to columns, bars, ...
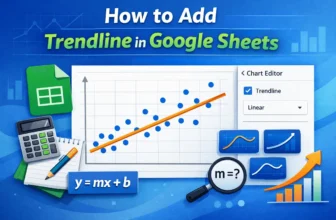
Trendlines are often used to understand the pattern of a dataset. If you want to track and analyze your data better, you might have to create a trendline after making a chart. In this article, you ...