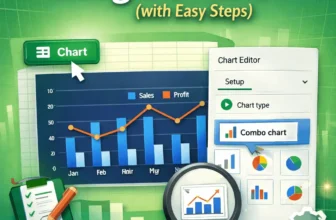
We use combo charts in Google Sheets to easily compare different types of data on one single chart. This makes spotting patterns and understanding complex information, such as sales and profit ...
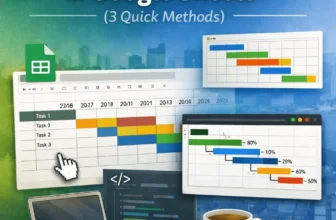
Gantt charts are essential tools for visualizing timelines, tracking project progress, and managing tasks over time. While Google Sheets doesn’t have a dedicated Gantt chart feature, you can still ...
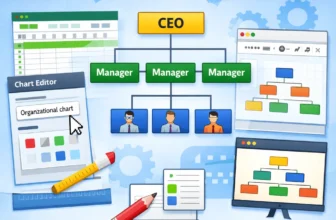
Organizational charts visualize team structures, reporting lines, and workflows in a company or project. If you manage teams or need to clarify roles and hierarchies, an org chart can save time and ...