

The Fisher test evaluates any significant association between two categorical variables. We can perform the Fisher test in Excel using the HYPGEOM.DIST function to get the one-tailed and two-tailed P values.
➤ Fisher test determines any association between two categorical variables. In this article, we’ll learn about Fisher’s exact test and how we can calculate the one-tailed and two-tailed P values using the HYPGEOM.DIST function.
➤ To calculate one-tailed P value: =HYPGEOM.DIST(sample_s, number_sample, population_s, number_pop, cumulative)
➤ To calculate two-tailed P value: =HYPGEOM.DIST(sample_s1, number_sample, population_s, number_pop, cumulative)+1-HYPGEOM.DIST(sample_s2, number_sample, population_s, number_pop, cumulative)
➤ Reject the null hypothesis if the Fisher test P value is less than the significance level.
➤ Fisher test is applicable when cell values and cell counts are small.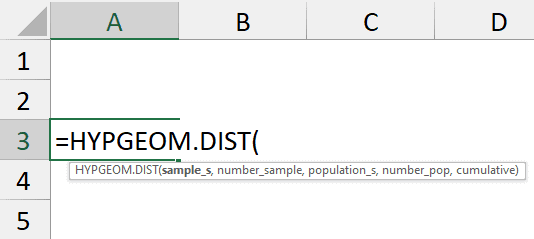
What is Fisher Test in Statistics?
The Fisher test or Fisher’s exact test determines any non-random associations between two categorical variables. Unlike the Chi-Square test, Fisher’s exact test is applicable for small sample sizes.
A typical Fisher’s exact test has the following hypothesis:
Null hypothesis: The two categorical variables are independent.
Alternate hypothesis: They are not independent.
HYPGEOM.DIST Function
The HYPGEOM.DIST function returns hypergeometric distribution. But we can use it to calculate the P value of Fisher’s exact test. For earlier versions of Excel, you can use the HYPGEOMDIST function.
Syntax
The syntax for the HYPGEOM.DIST function is given below. It takes 5 mandatory arguments.
=HYPGEOM.DIST(sample_s, number_sample, population_s, number_pop, cumulative)Here is the syntax for the earlier version of this function.
=HYPGEOMDIST(sample_s, number_sample, population_s, number_pop)
➤ sample_s: number of successes present in the sample
➤ number_sample: size of the sample
➤ population_s: number of successes present in the population
➤ number_pop: size of the population
➤ cumulative: TRUE returns the cumulative distribution function while FALSE returns the probability distribution function
Fisher Test vs Chi-Square Test
The Chi-Square test should be used for larger cell values and cell counts.
The Fisher test is suitable when:
➤ Cell count is less than 20.
➤ Expected cell value is less than 5.
➤ The row and column marginal values differ greatly.
Example of Fisher’s Exact Test in Excel
Consider the two-by-two contingency table comparing the success and failure of treatment A and treatment B. The two hypotheses are stated below:
Null hypothesis: The success and failure of treatments A and B are independent.
Alternate hypothesis: The success and failure of treatments A and B are not independent.
Steps:
➤ Select the output cell (C6) and enter the formula to get the one-tailed P value.
=HYPGEOM.DIST(B2,$B$4,$D$2,$D$4,TRUE)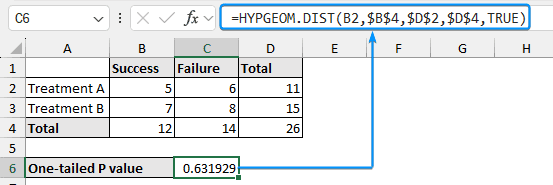
➤ To calculate the two-tailed P value use the formula below.
=HYPGEOM.DIST(B2,$B$4,$D$2,$D$4,TRUE)+1-HYPGEOM.DIST(B3,$B$4,$D$2,$D$4,TRUE)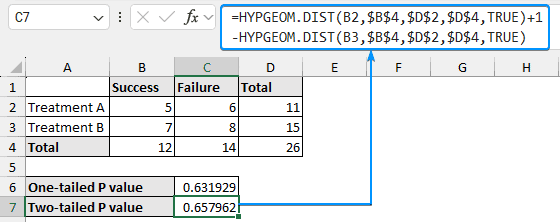
Downloadable Resources
Get our practice workbook or necessary files that we have worked with to prepare this article.
Wrapping Up
In this quick tutorial, we’ve learned about the Fisher test and we can calculate the one-tailed and two-tailed P values using the HYPGEOM.DIST function in Excel. Feel free to download the practice file and share your thoughts in the comments below.