A sales report contains sales data, insights into various products and regions, the performance of different salespeople, and an overview of the company’s sales data. Sales reports are often compiled every month to provide senior management with an overall insight into the company’s sales department. In this article, we will learn how to make a sales report in Excel. We will create various charts and graphs to visualize the sales data and utilise pivot tables to make the dashboard dynamic as well.
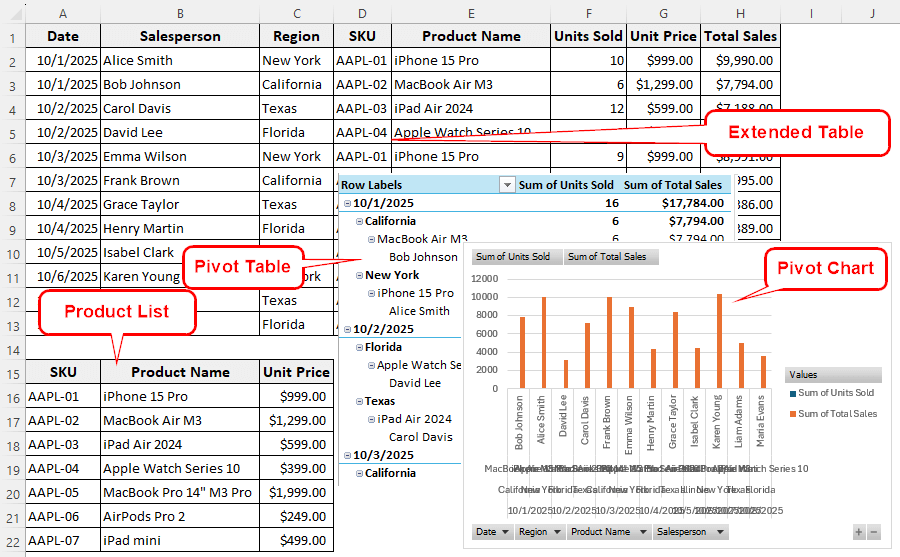
➤ Extend the sales data with product names, unit prices, and total sales amount from the product list.
➤ Prepare a pivot table so that you can easily manipulate the data.
➤ Add a pivot chart to visualize the data and dynamically change the fields.
Preparing a sales report in Excel is easy when you have the sales data ready. Below, we will outline the steps required to create a sales report in Excel. Therefore, open your MIS dashboard, download the data, and follow the instructions from this tutorial.
Steps to Make a Sales Report in Excel
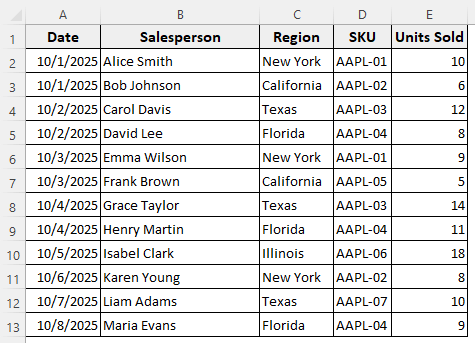
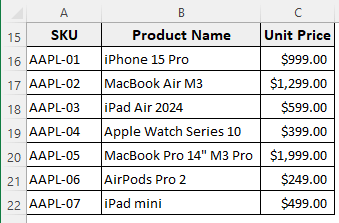
Here, we have some data from the MIS dashboard, including dates, names of salespersons, regions, SKUs sold, and the number of units sold. We have another table with a product list and unit prices. With this data, we will prepare a sales report.
Sales Data:
Product List:
Step 1: Prepare the Table
We will add the product names, unit prices, and total sales to the source table, and then create the report with the table.
➤ Right-click on column E, and select Insert to add a column to the left.
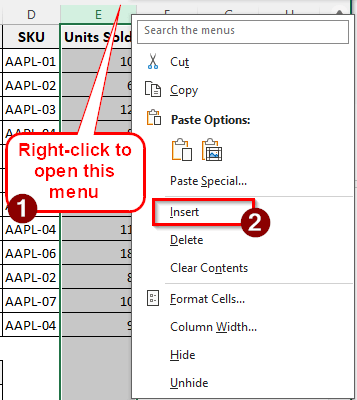
➤ Name this column Product Name.
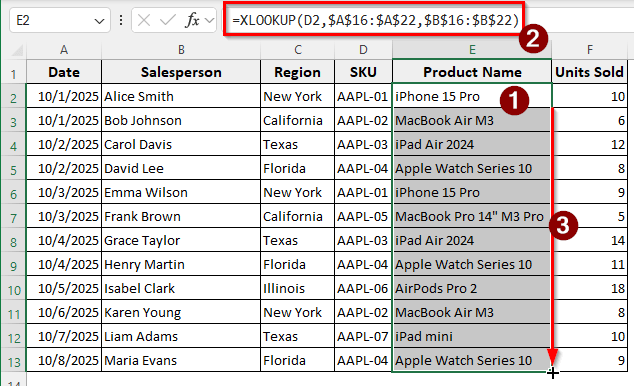
➤ Insert the following formula in the E2 cell, and autofill:
=XLOOKUP(D2,$A$16:$A$22,$B$16:$B$22)
➤ Add two more columns for Unit Price and Total Sales.
➤ Insert the following formula in the G2 cell:
=XLOOKUP(D2,$A$16:$A$22,$C$16:$C$22)
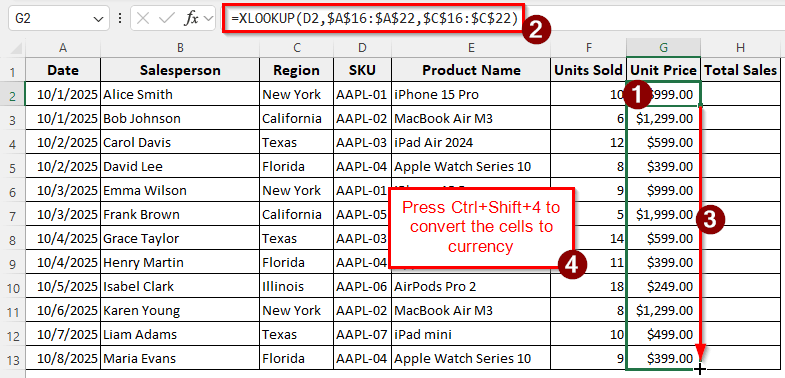
➤Autofill the column, then press Ctrl + Shift + 4 to convert those cells to currency.
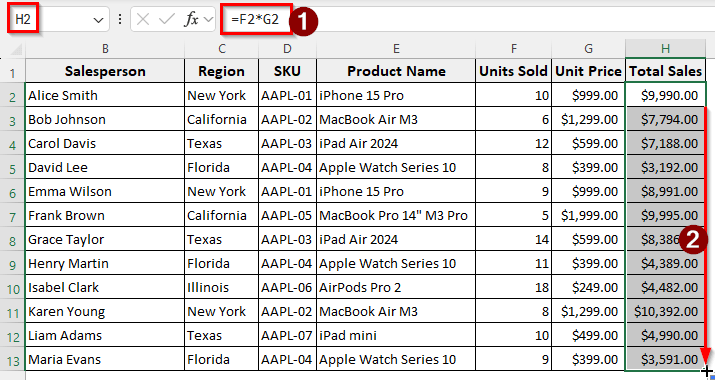
➤ Finally, calculate the total sales using the following formula in the H2 cell and fill the rest of the rows:
=F2*G2
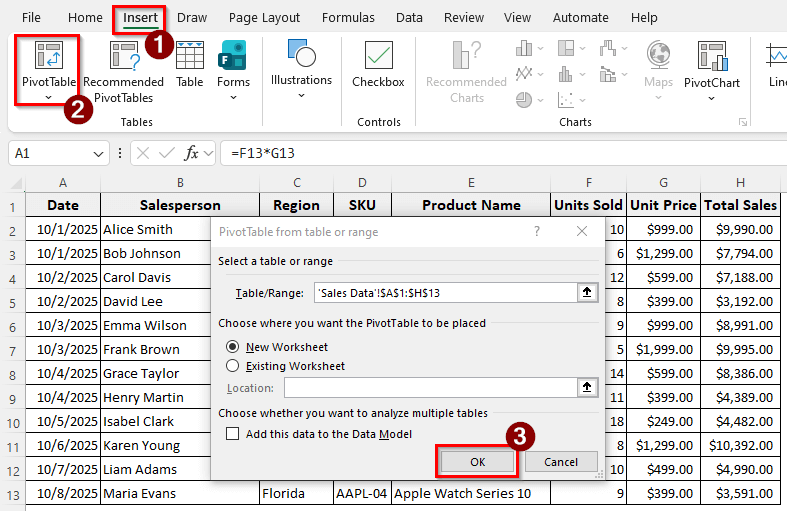
Step 2: Create a Pivot Table
A pivot table will make the report extremely easy to prepare and allow you to change the report elements whenever needed dynamically. Here is how you do that:
➤ Select the table, and go to Insert > PivotTable. Press OK to create a pivot table.
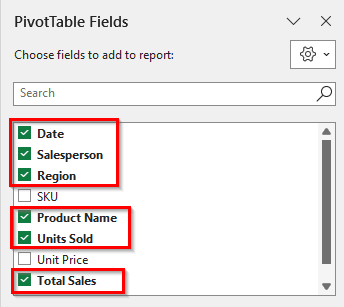
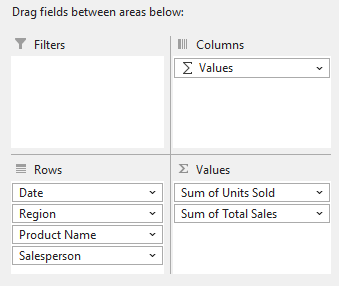
➤ In the PivotTable Fields panel, select the fields according to the following image:
➤ Sort the fields like the image below:
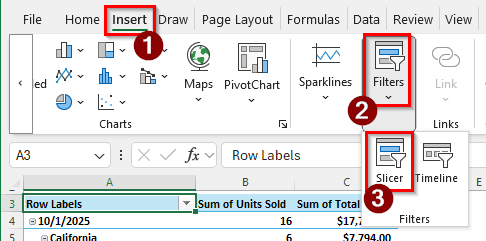
➤ Now, to freely modify the table, add a slicer from Insert > Filters > Slicer.
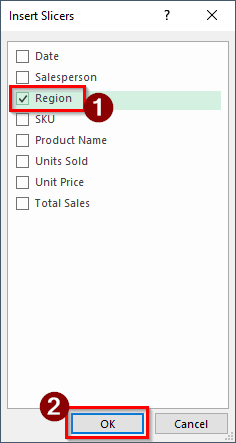
➤ We are choosing the Region slicer here. Press OK to confirm.
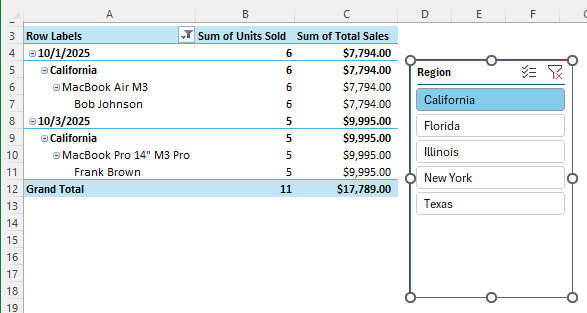
➤ Now we can select a single region or multiple regions to show the sales data for that.
Step 3: Add a Chart
We have created a pivot table in the previous step. Now, if we create a makefrom that table, it will be a pivoted chart that can be dynamically changed.
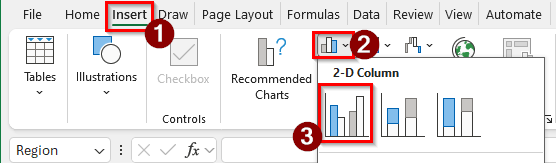
➤ Go to Insert > 2-D Column and select the first chart.
➤ A chart will be added to the sheet.
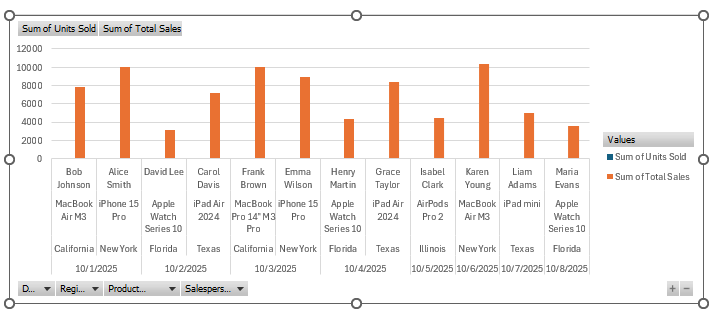
➤ The chart can be directly pivoted. For example, we can select a product from the bottom, and the chart will only show the values related to that particular product.
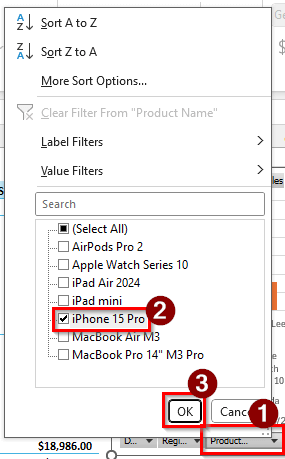
➤ Click on Product to open the context menu, deselect everything, and only keep “iPhone 15 Pro” selected. Press OK to continue.
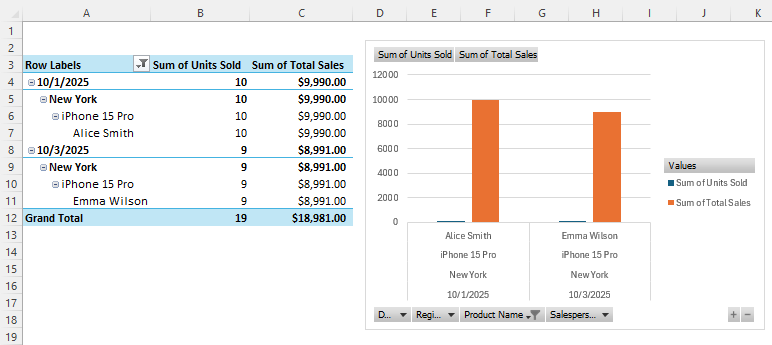
➤ The chart and the pivot table will both be changed.
Frequently Asked Questions
How to generate a report?
It depends on the type of report you are making. Most reports include a concise summary of data that can be easily understood by the target audience, along with detailed data and analysis for experts. Some reports are best made in PowerPoint, some in Excel, and some in Word.
What is Ctrl + T in Excel?
That shortcut is for creating a table. Select a range of data that you want to convert to a table, and press Ctrl + T to make the range a table. You can also press Ctrl + T and then select the range from the dialogue box.
Can Excel generate reports?
Excel cannot generate a command report. However, you can prepare a report with the help of Excel. There are a lot of functions in Excel, and you can prepare formulas with the help of those functions to generate reports.
Can ChatGPT write a report?
Yes. ChatGPT can prepare a report with the data you provide, but you must be skilled at prompting, as ChatGPT utilises Python to build reports. Always request an editable file format, such as xlsx, docx, or pptx, so that you can make changes as needed. Do not generate a PDF report using ChatGPT.
How to use F4 in Excel?
After you write a cell reference in the formula of an Excel sheet, you can press F4 to turn the cell reference into an absolute reference. If the cell is an absolute reference, it will not change when you copy the cell to autofill other cells.
Wrapping Up
In this article, we have learned how to make a sales report in Excel. The key to creating a good report is to include sufficient data and present it effectively through visualization. Ensure that you select the metrics your management wants to see, and prepare a report that you will want to read. Good luck with your sales report, and we will see you in the next article.