
Excel Charts
How to Rename Legend in Excel (2 Quick Methods)
A legend is the section of a chart representing the data series. It indicates different shapes, colors, fills, etc. By default, Excel names the legend after the column header or

A legend is the section of a chart representing the data series. It indicates different shapes, colors, fills, etc. By default, Excel names the legend after the column header or

The legend is a section of the chart that indicates what different colors, lines, and areas mean in the chart. The legend always shows the color of the data series.

A legend is a chart element that explains colors, symbols, or patterns used to represent different data series. It always shows what the series represents. So, to change the order
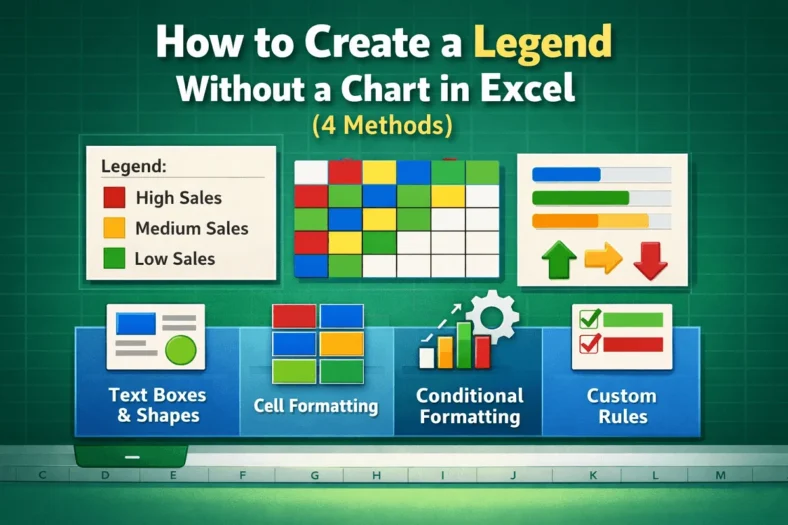
A legend is the part of a chart indicating different shapes, colors, fills, etc. of each data series. But a legend without a chart? The primary goal of a legend
A legend is a section of a chart that explains what different colors, lines, shapes, etc. mean. It is a visual guide for users to understand each series better. It

A legend is a section of the chart that represents the meaning of different colors, lines, shapes, etc. It works as a visual guide for understanding each series better. Editing

Charts are the visual representation of data. We use charts to quickly identify patterns and trends instead of going through an overwhelming amount of data. You can use the features
Displaying percentages in graphs can help viewers to understand the relative distribution of different categories. You can add these percentages directly using the data label formatting, or by calculating them