Excel for Statistics
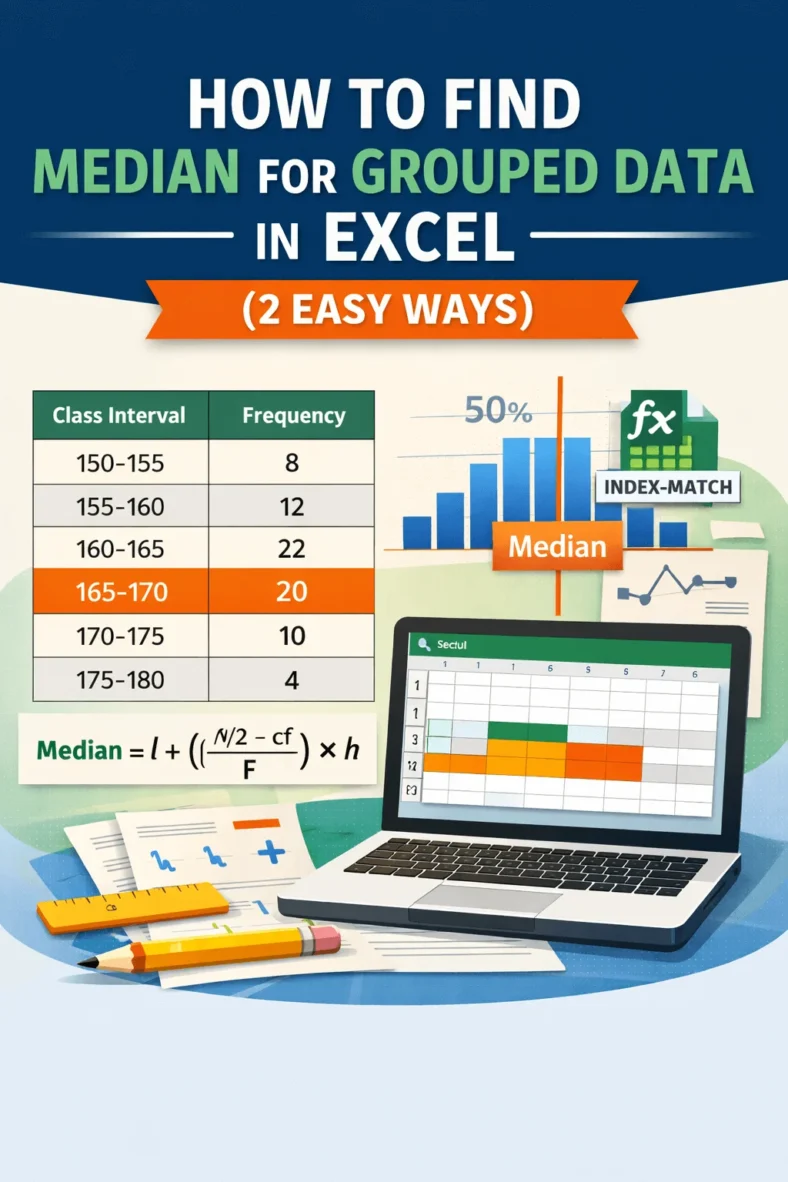
How to Find Median for Grouped Data in Excel (2 Easy Ways)
It can be challenging to find the median for grouped data in Excel because there isn’t a built in function for it. To find the median for grouped data, follow

It can be challenging to find the median for grouped data in Excel because there isn’t a built in function for it. To find the median for grouped data, follow
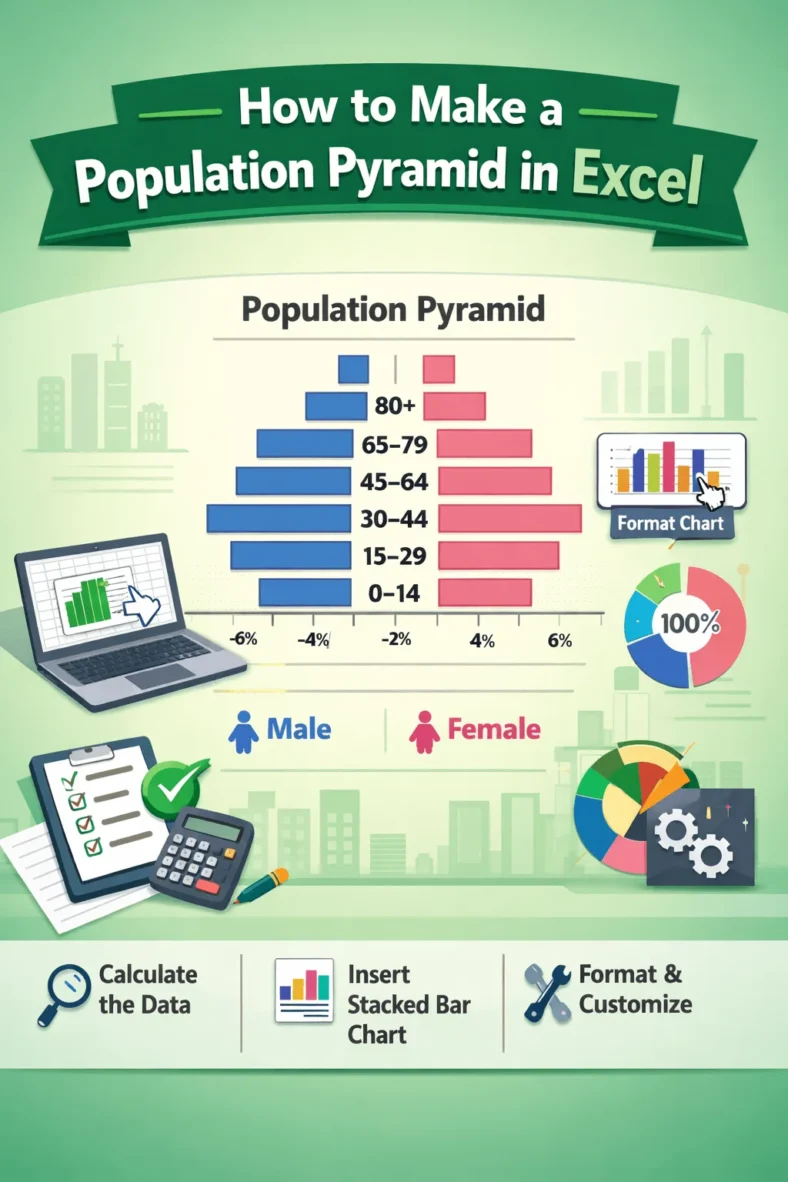
A population pyramid illustrates how a population is distributed by age and gender. You have likely seen one before in demographic studies or population reports. For reports, demographic studies, or

Demographers, economists, and policymakers need to understand the population growth rate because it helps them plan for the future and shows how quickly a country’s population is growing. In this

One of the simplest yet most efficient methods for obtaining organized data is through questionnaires. In this tutorial, you will learn how to create a questionnaire in Excel using the
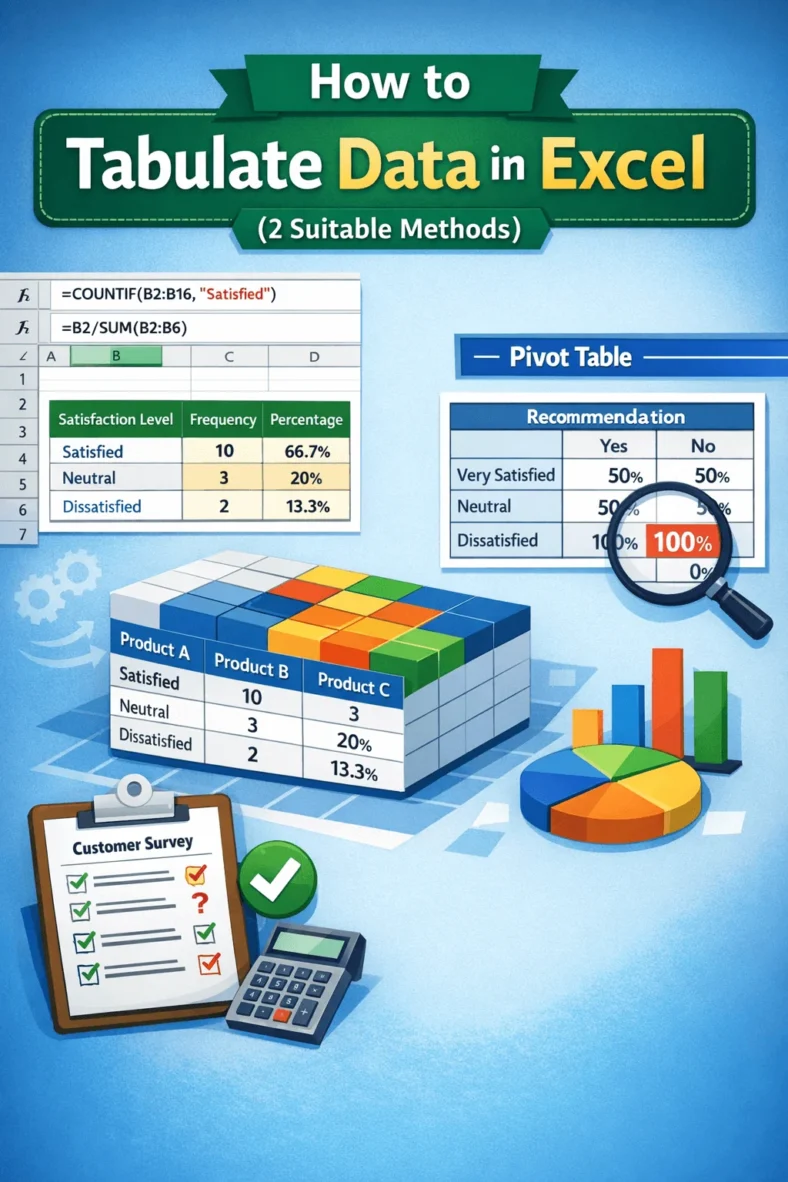
Gathering survey data is the first step. The true value lies in tabulating the results, which transforms the raw data into meaningful and useful insights. In this article, you’ll learn
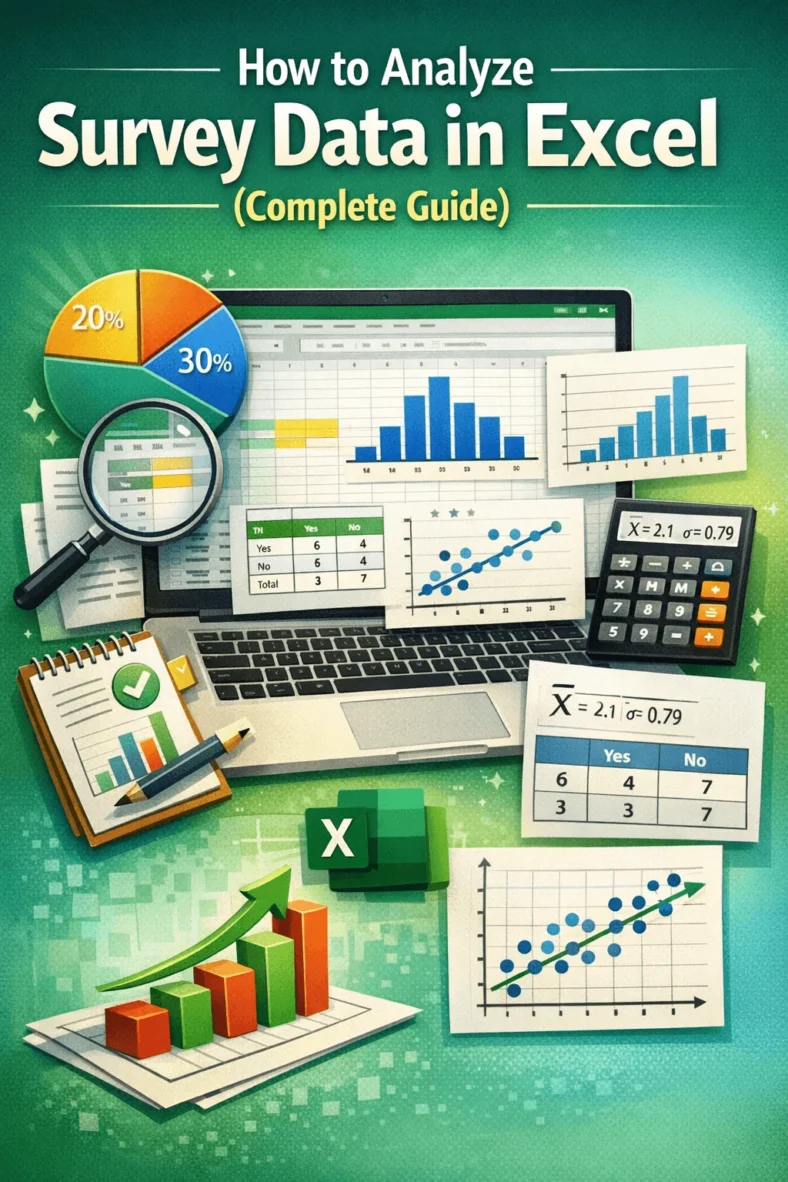
When looking at survey answers in Excel, you can transform and extract useful information from them. Whether you are a researcher, student, or marketing analyst, you can use Excel to
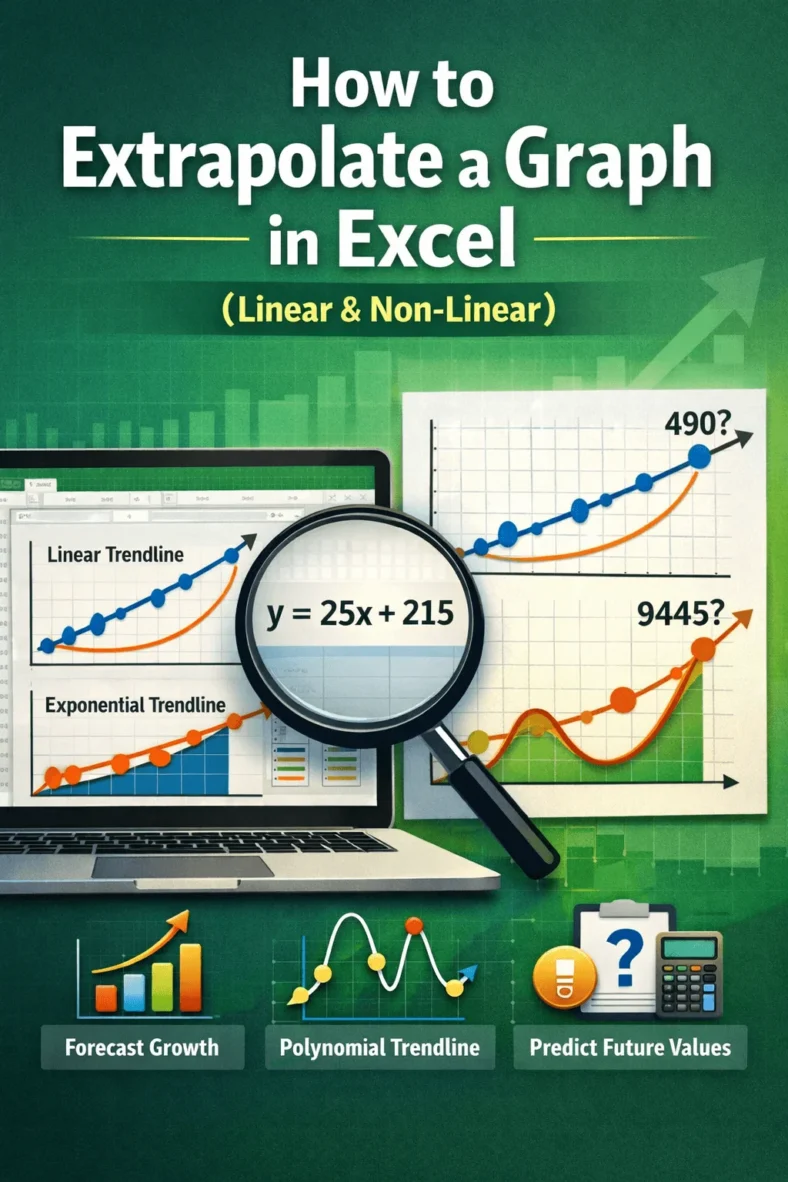
Need to forecast values outside of the current data range? You can extrapolate the trend graphically by using Excel’s Trendline and Forecast feature. This article explains how to extrapolate a
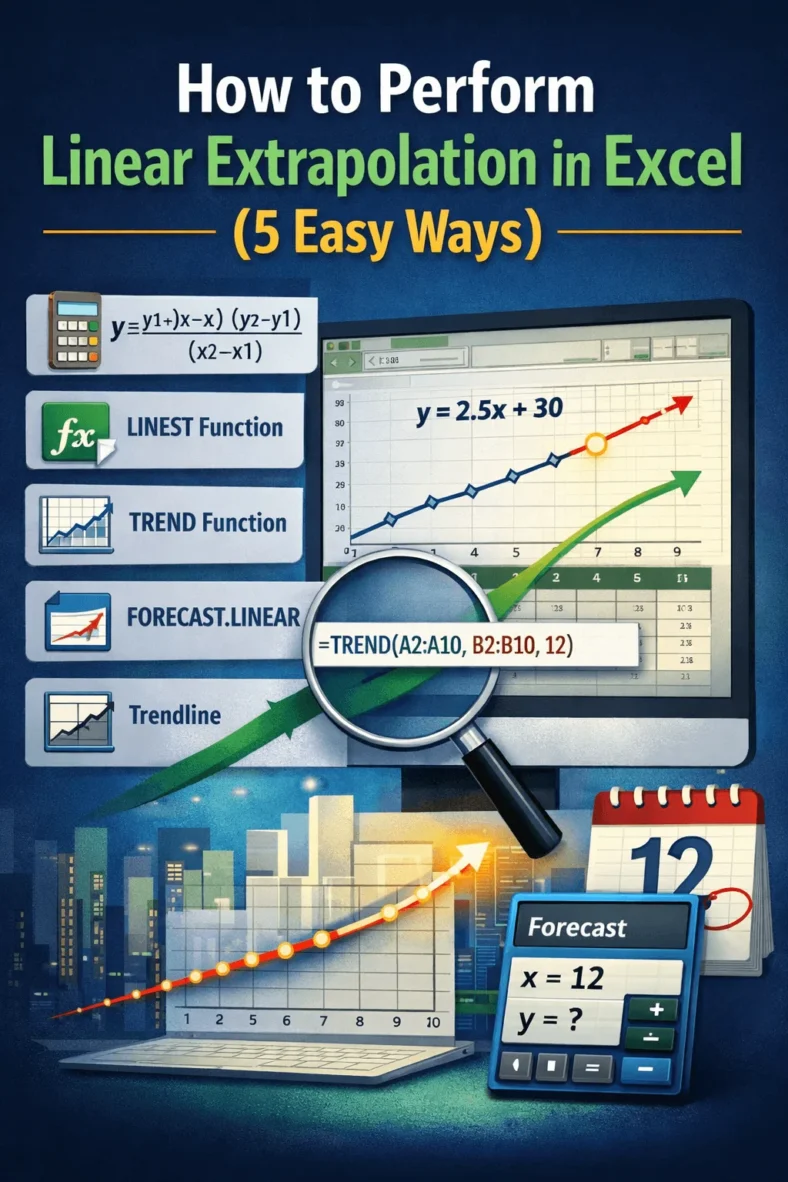
Linear extrapolation is useful for estimating future values based on historical trends, whether you’re analyzing business indicators or projecting future growth. From using simple formulas to charting tools, this blog
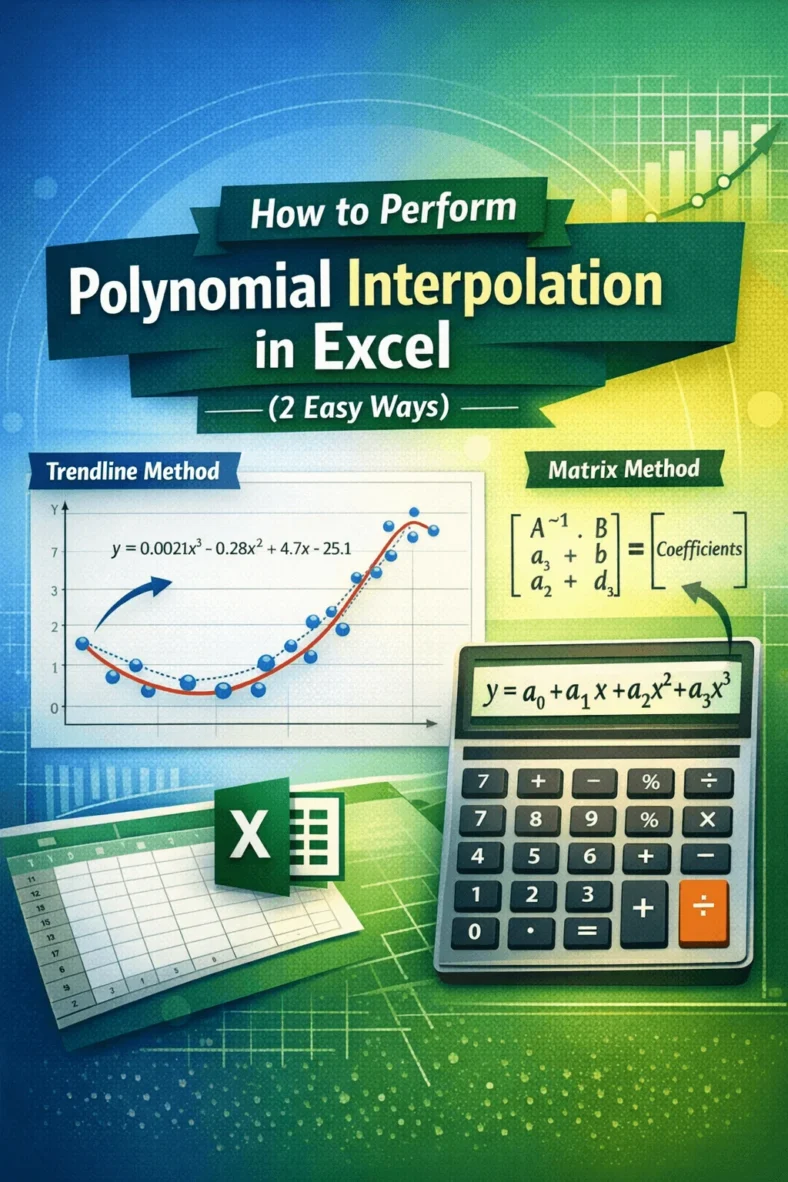
Polynomial interpolation is a useful approach when working with non linear data and trying to estimate values between known data points. Excel offers built in features that will help you