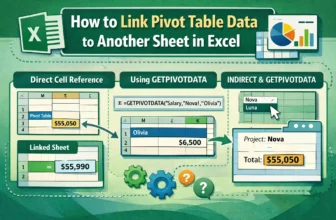
Pivot Tables are used for summarizing and analyzing vast amounts of data in Excel. However, the summarized results often need to be presented on a separate sheet for further analysis. Linking a Pivot ...
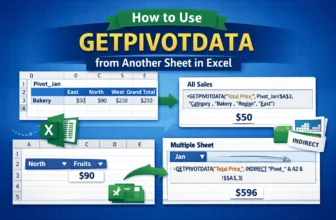
Pivot Tables are used for summarizing large datasets, but often, the summarized data needs to be pulled into a different sheet for analysis. Excel’s built-in GETPIVOTDATA function is designed to ...
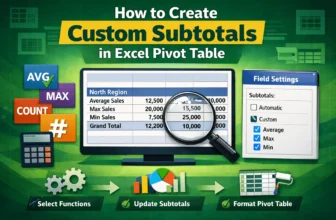
Pivot Tables are one of the tools used in Excel for summarizing large datasets. By default, Pivot Tables provide a Sum as the subtotal for each group. However, for more versatile analysis, you might ...
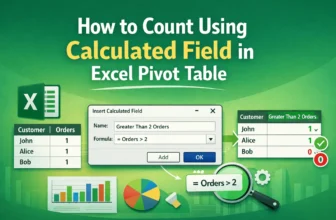
Pivot Tables focus on summarizing data in Excel. While they provide standard aggregation methods like Sum and Count, sometimes you need a more advanced calculation, such as a conditional count or a ...
Pivot Tables are used for summarizing large datasets in Excel. While displaying the sum of values is standard, calculating the percentage of the grand total is crucial to show the contribution of ...
Slicers are used to filter data in Excel Tables, Pivot Tables, and Pivot Charts. While they inherit colors from the workbook's theme by default, you can customize a Slicer's color to make it look ...
Pivot Tables are used for summarizing and analyzing large datasets in Excel. To focus analysis on specific subsets of data, filtering is important. While manually checking boxes in the filter ...
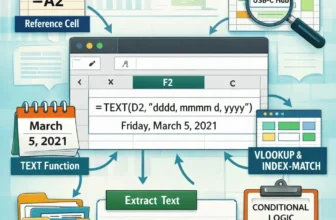
Displaying text from another cell in Excel is a common task for data analysis and for automating your workflow. Whether you are creating summaries, performing complex lookups, or simply reformatting ...
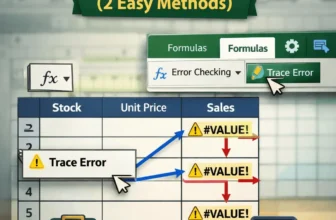
If you’re a regular Excel user, it’s almost impossible that you’ve never encountered an error. Let’s say you’re tracking sales data. You want to multiply the stock quantities and unit price. But ...