The hierarchy chart is a visual representation of a system where elements are organized according to importance, authority, or relationship levels. It helps users to clearly visualize team ...
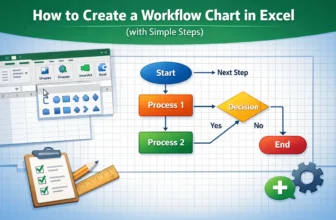
A workflow chart in Excel visually represents the sequence of steps in a process, making it easier to understand, analyze, and improve operations. With Excel’s built-in tools like Shapes, Connectors, ...
If you often work with multilingual datasets, it is essential for you to know how to translate Portuguese to English. By using Excel’s built-in translation functions and tools, you can easily convert ...
Rounding up numbers is useful in cases where precision is important, like financial reporting, budgeting, grading system, or scientific measurements. Whether you’re working with fluctuating decimal ...
Merging multiple columns in Excel is a common task, especially when combining data like full names or addresses that are split across separate columns. Although Excel has no direct tools that allow ...
Combining rows with same ID is often necessary in Excel when dealing with datasets containing multiple entries for the same record, such as transactions, customers, or orders. Although there are no ...
Both sorting and filtering help you arrange a large database according to specific criteria. While both functions help in organizing data, they serve different purposes. Sorting helps you ...
When working with datasets in Excel, it is often required to assign values based on ranges, such as determining student grades from scores or employee bonuses from sales figures. Although we can ...
Finding the median of values that satisfy specific criteria is frequently necessary when analyzing commercial or real estate data. Although Excel lacks a built in MEDIAN IF function, you can ...