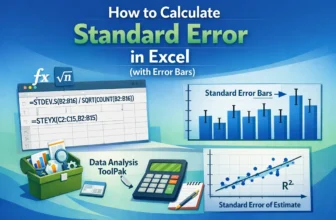
Understanding how data differs is important whether you're comparing airline performance, assessing marketing strategies, or summarizing survey findings. Standard error is one such statistic that ...
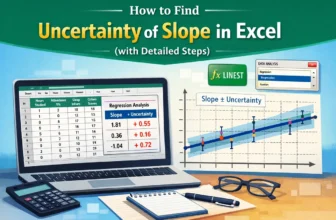
We’ve all fitted a line to data points and calculated its slope. But how certain is that slope? This tutorial will answer the question of how to find the uncertainty of slope using Excel. A clear ...
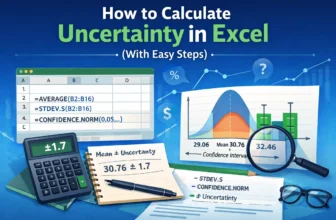
Excel makes it easy to calculate uncertainty, which helps you determine your data's consistency. Understanding uncertainty is important for improving performance and establishing reasonable ...
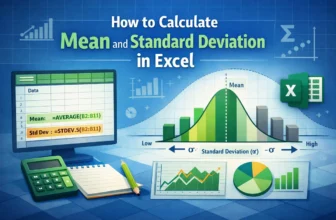
Excel functions allow you to easily and correctly calculate the mean and standard deviation. Understanding the correct statistical concepts is important whether you are analysing sales performance, ...
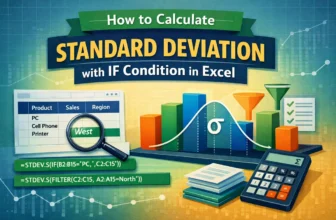
Standard deviation is the variation or dispersion in a set of observations. Sometimes, you may want to calculate the standard deviation for a subset of your data based on a specific condition. You ...
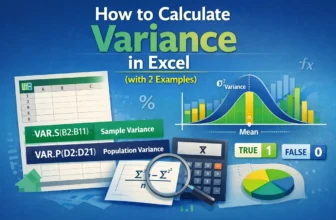
Variance indicates how much the values in a dataset deviate from the mean (average). You can use built-in Excel functions to calculate the variance.➤ Variance measures the degree to which the ...
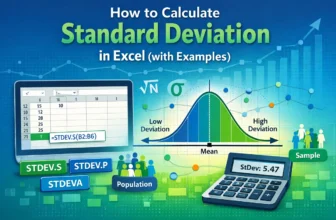
Standard deviation indicates the variation or dispersion of a set of observations. It signifies the deviation of each observation from the mean. You can use built-in Excel functions to calculate the ...
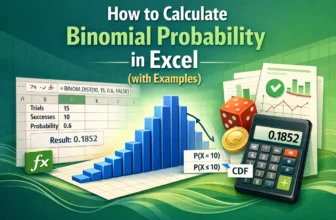
A binomial distribution summarizes the number of successes in a fixed number of independent and identical trials. You can calculate binomial probability using a built-in Excel function.➤ A ...
Probability is the likelihood that a particular event will occur. It is expressed as a number between 0 and 1. You can calculate probability using a built-in Excel function.➤ Probability is ...