A trendline is a line that shows the overall flow or pattern of data. Inserting a trendline in an Excel cell can provide a quick look at the actual data trend beside it.
In Excel, the trendline is a feature limited to charts only. However, you can use sparklines.
Sparklines are representations of data trends without any axes or labels. Viewers can get a quick overall direction and pattern of data from sparklines. So, it works the same as a trendline.
To insert a trendline in an Excel cell,
➤ Sparklines act as cell trendlines in Excel.
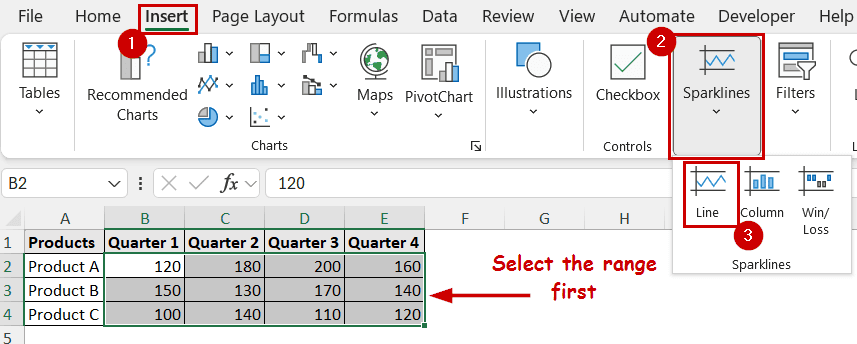
➤ Go to Insert >> Sparklines (group) >> Line.
➤ Select the proper range to plot the trendline from and the output cell.
Sparklines and trendlines are two different features within Excel. As they work the same, we will cover how to create sparklines to mimic inserting trendlines in the Excel cell.
Download Practice WorkbookWhy Insert Trendline in Excel Cell?
Inserting trendlines in Excel cells instead of charts can have multiple benefits:
- It shows trends without taking up much space.
- Quick visual interpretations without axes and labels.
- Adding trendlines in cells beside each other, you can compare multiple trendlines from different series more easily.
How to Insert Trendline in Excel Cell
The Insert tab in the Excel ribbon offers many types of objects to insert on a sheet. Sparklines are one of those objects.
We will use the line sparklines as trendlines in Excel cells. They are available in the Sparklines group.
This is the data we are using.
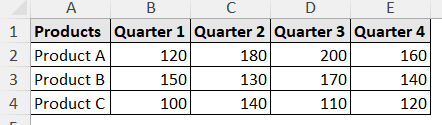
The data contains the sales quantity of different products across different quarters. We are going to plot the trendlines in the cells beside (range F2:F4).
Steps:
➤ Select the range you want to plot (B2:E4).
➤ Go to Insert >> Sparklines (group) >> Line.
➤ Select the output range in the Create Sparklines dialog box.
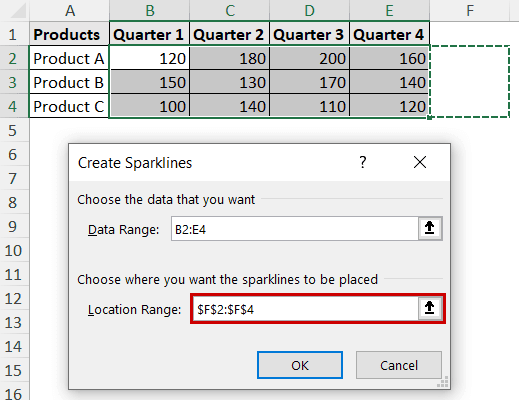
➤ Click on OK.
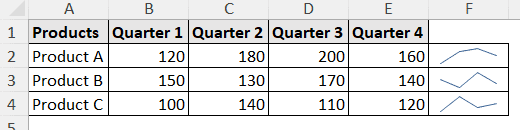
The range you have selected will contain the trendlines.
Note: Although they work as “trendlines”, Excel will still consider them as sparklines. So, you might not get all the customizable features available for trendlines in Excel.
FAQ
Why can’t I add a trendline in Excel?
Excel doesn’t support adding trendlines to all types of charts. Some charts, like scatter, line, bar, etc., can contain trendlines. If the Trendline option is unavailable in any of the element-adding methods, chances are you are probably using the wrong type of chart.
How to remove sparklines in Excel?
You can remove the trendlines in cells or sparklines in two ways.
You can use the clear option from the Home tab after selecting the sparklines to remove the sparklines (or any cell content). For sparklines, you can use the clear feature from the Sparkline tab, too.
Conclusion
In this tutorial, we have discussed the trendline in cells. As the feature isn’t directly available, we used the Sparklines feature to mimic the trendline in Excel cells. To insert a sparkline, we have used the Insert tab. All the sparkline types are available under the Sparklines group there.
Feel free to download the workbook and give us your feedback.