When we work with large datasets in fields like business, research, or academics, simple formulas often fail to capture all the important insights. In such cases, we need more advanced calculations and statistical techniques. And the Data Analysis ToolPak is the perfect choice to perform these techniques. It allows us to perform complex analyses, including regression, ANOVA, correlation, forecasting, etc., without manual formulas.
Suppose you are analyzing students’ test scores from multiple classes. If you only calculate averages, you might miss important findings like whether two test results are strongly related, whether one group consistently performs better than another, or if there’s a trend in performance over time. In this case, with the Data Analysis ToolPak, you can run correlation, ANOVA, regression, and many other statistical tests directly in Excel and make your analysis accurate.
In this article, we will learn how to use the Data Analysis ToolPak in Excel so that you can perform different analyses on your dataset.
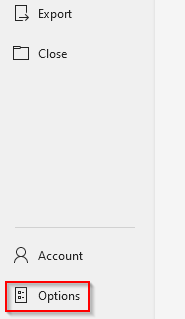
➤ First, click on the File tab, and it will take you to a new window. Select Options from the bottom of that page.
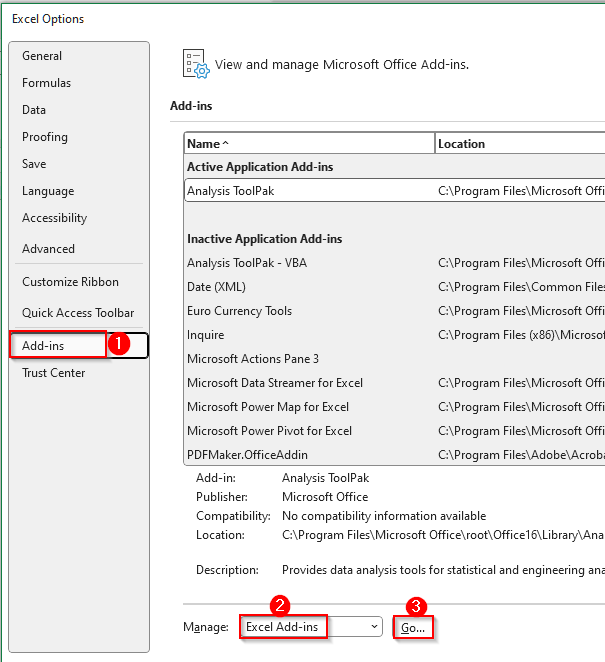
➤ Another page will open, and on it, select Add-ins. It will show a few options.
➤ Now, at the bottom, choose Excel Add-ins from the Manage box and click Go. It will open a new pop-up.
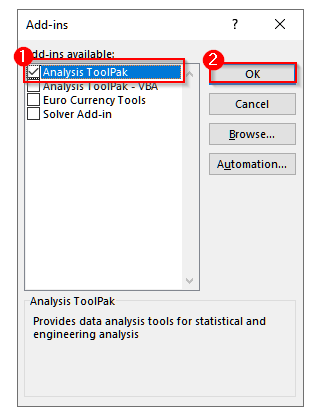
➤ Now, check the box for Analysis ToolPak and click OK.
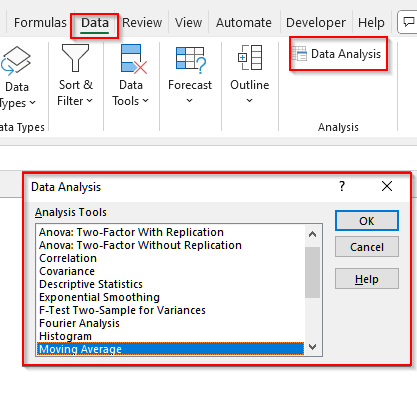
➤ Then, go to the Data tab, and you will see Data Analysis under the Analysis menu.
➤ First, click on the Data tab.
➤ Now, select Data Analysis from the Analysis group. You will see a dialog box appear listing all the available tools.
➤ Now, you can simply click on the tool you want to use and press Ok. It will provide you with the output.
Steps to Use the Data Analysis ToolPak in Excel
The Data Analysis ToolPak in Excel is an add-in that lets us use advanced statistical and engineering analysis tools. By enabling it, we can perform complex calculations like regression, correlation, ANOVA, and forecasting without any complex formulas.
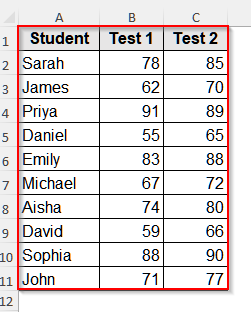
We will use the dataset below to explain how to use the Data Analysis ToolPak in Excel.
Step 1: Enable the Data Analysis ToolPak
To use the Data Analysis ToolPak, you need to enable it first.
➤ First, click on the File tab, and it will take you to a new window. Select Options from the bottom of that page.
➤ Another page will open, and on it, select Add-ins. It will show a few options.
➤ Now, at the bottom, choose Excel Add-ins from the Manage box and click Go. It will open a new pop-up.
➤ Now, check the box for Analysis ToolPak and click OK.
➤ Then, go to the Data tab, and you will see Data Analysis under the Analysis menu.
Step 2: Open the Data Analysis Tool
Now, we will explain how to open the Data Analysis tool so that you can continue further analysis.
Steps:
➤ First, click on the Data tab.
➤ Now, select Data Analysis from the Analysis group. You will see a dialog box appear listing all the available tools.

➤ Now, you can simply click on the tool you want to use and press Ok. It will provide you with the output.
Frequently Asked Questions
Can I Use the Data Analysis ToolPak on Mac?
Yes, you can use the Data Analysis ToolPak in Excel for Mac. To use it, first enable it by going to the Tools menu, then select Excel Add-ins. Finally, check the Analysis ToolPak option. Once you activate it, the Data Analysis button will appear under the Data tab, and you can run statistical tools like regression, ANOVA, histograms, etc.
Do I Need Advanced Statistical Knowledge to Use the Data Analysis ToolPak?
Not necessarily. The Data Analysis ToolPak does not require any manual calculation or formula, and you can perform complex statistical calculations just by selecting the tool name. So, you don’t need advanced statistical knowledge to run this tool. However, having a basic understanding of concepts like correlation, regression, or ANOVA will help you interpret the results correctly and avoid misusing the output.
Can I Use the Data Analysis ToolPak in the Online Version of Excel?
No, the Data Analysis ToolPak add-in is not available in the online version of Excel. It only works in the desktop versions for both Windows and Mac. In Excel Online, you’ll need to use manually entered formulas, PivotTables, or third-party add-ins to perform similar statistical analyses.
Wrapping Up
In this article, we have learned how to use the Data Analysis ToolPak for advanced analysis. After enabling this add-in, you can easily perform different tasks like correlation, regression, descriptive statistics, etc. You also do not need to use any complex formula. Give this tool a try and let us reach out if you have any inquiries or feedback.