Annual growth rates help in understanding the investment return rate over one year. Imagine you have a stock that you bought for a certain amount of money, and the price of the stock has increased over the years. You would want to know the growth rate of that stock to understand whether it was a good investment or not compared to other investment options. Calculating the annual growth rate would help you do just that. In this article, we will learn how to calculate regular annual growth rate and compound annual growth rate in Excel.
➤ Enter the following formula into your target cell, and autofill the other cells in the column if necessary:
=(B3-B2)/B2
➤ Replace B3 with the new value and B2 with the old value.
Annual growth rates help make financial decisions and understand the profitability of the current investments. This article will teach you how to calculate the annual growth rate using some functions and mathematical expressions with the help of Microsoft Excel.
What is the Annual Growth Rate?
Annual growth rate is a financial metric that indicates the percentage increase of a monetary value over a year. For example, if a company earns $ 10,000 in 2024 and is expected to earn $ 11,000 in 2025, its annual growth rate of revenue is (11,000/10,000)-1 = 0.1, which is 10%. This financial measure is required as in future years, this rate can be used as a benchmark or comparison.
In Excel, we can calculate the annual growth rate for a single year or the compound annual growth rate for multiple years. If we have an investment for 10 years, for example, we can calculate the growth rate it has achieved in 10 years using a few functions and formulas. We will learn all of them in this tutorial.
Calculating Simple Annual Growth Rate
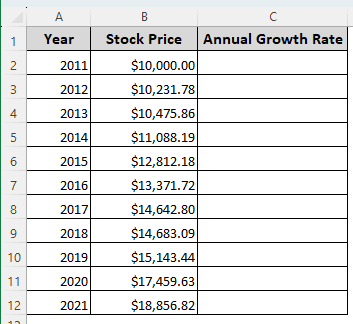
We have a table here with 11 years of stock prices. In 2011, the stock price was 10000 dollars, and the price has kept rising since then. We will calculate the annual growth rate for each year in this method to understand the condition of that stock.
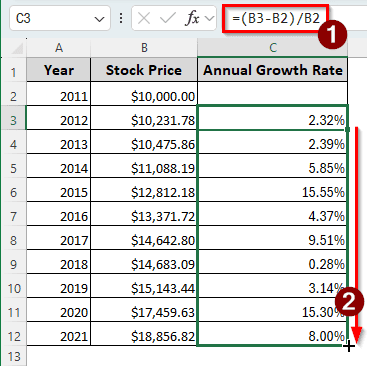
➤ Select C3:C12 cells and press Ctrl + Shift + % to change the cell type to percentage.
➤ In the C3 cell, write either of the following formulas:
=(B3-B2)/B2
=(B3/B2)-1
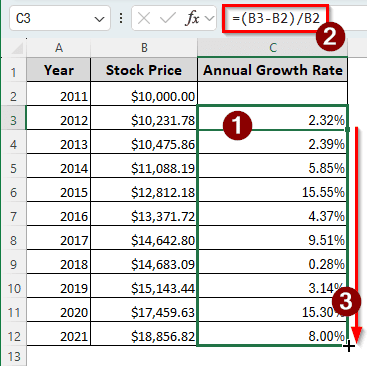
➤ Press Enter, then find the small plus (+) sign at the bottom right of the cell. Click on that, and drag to the C12 cell to calculate the annual growth rate for all those years.
Computing the Average Annual Growth Rate
Now that we have calculated the annual growth rate, we can calculate the average annual growth rate using that. We can use a few functions to do that.
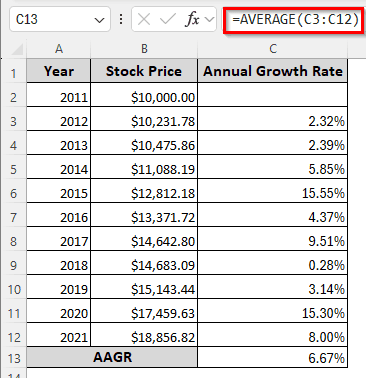
Utilizing the AVERAGE Function
The AVERAGE function can be used to average the annual growth rate calculated from the previous method.
➤ Insert the following formula in the C13 cell:
=AVERAGE(C3:C12)
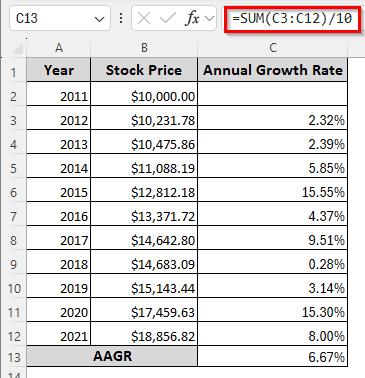
Applying the SUM Function
Instead of averaging using a dedicated function, we can sum up the growth rate using the SUM function and divide it by the years. Here is how to do that:
➤ The following formula can be used to calculate the average annual growth rate:
=SUM(C3:C12)/10
Measuring Compound Annual Growth Rate
In most cases, people want to know the compound annual growth rate to measure the stock’s viability. There are a few methods to do this in Excel, with and without dedicated functions.
Using Manual Calculation
While Excel provides dedicated functions to calculate CAGR, knowing how to calculate it using mathematical expressions can help enrich your financial knowledge. Here is how to calculate CAGR manually:
➤ Enter either of the following formulas in the B13 cell:
=(B12/B2)^(1/10)-1
=POWER(B12/B2,1/10)-1
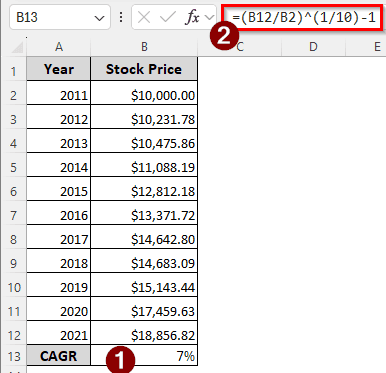
➤ Press Enter and Ctrl + Shift + % to convert the result to a percentage.
Making Use of the Dedicated RRI Function
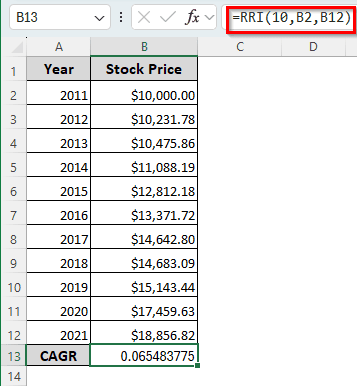
Excel has the RRI function that can be used to calculate the compound annual growth rate. Here is how we can use that in our sheet:
➤ Insert the following formula in the B13 cell:
=RRI(10,B2,B12)
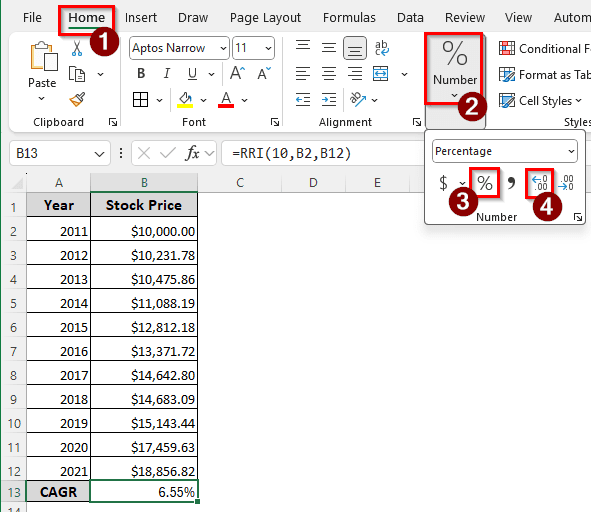
➤ In the Home tab of the ribbon, go to the Number section, and select the percentage (%) icon to change the cell number format to percentage.
➤ Click on the Increase Decimal icon twice to get a more accurate calculation.
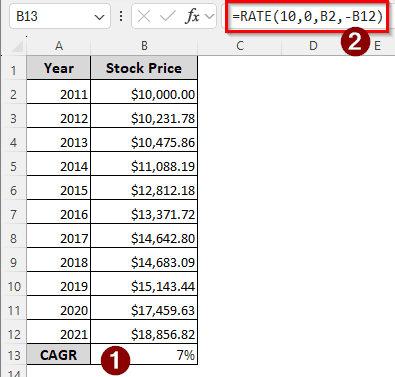
Applying the RATE Function to Calculate CAGR
The RATE function is used for generic interest rate calculation in Excel. We can use that to calculate CAGR as well.
➤ Enter the following formula in the B13 cell:
=RATE(10,0,B2,-B12)
Frequently Asked Questions
How do you calculate the rate increase in Excel?
The following formula can be used to calculate the percent change:
=((A2-A1)/A1)*100
Here, A2 is the new value, and A1 is the old value.
What is a good YoY growth rate?
The year-on-year growth rate, or the annual growth rate, should be 10% to 20% for businesses to be considered a good growth rate. However, it usually depends on the industry the company belongs to.
Is CAGR better than ROI?
It is the opposite. Return on investment (ROI) can be measured using different time periods, but compound annual growth rate (CAGR) only works with full years. As a result, ROI provides a more accurate picture of the investment than CAGR.
What is the rule of 72 for CAGR?
The rule of 72 can help you learn how many years it would take to double your investment at the specified interest rate. The formula to do that in Excel would be as follows:
=72/A1
Here, A1 is the reference to the interest/return rate. After pressing Enter, we will get the year count it would take to double the money.
Is IRR the same as CAGR?
No. IRR uses all cash flows to calculate the rate of return. It is a more complex calculation as it requires multiple net present values to calculate the value. CAGR, on the other hand, is a simple calculation that only uses the initial and the ending values.
Wrapping Up
In this article, we have learned how to calculate the annual growth rate in Excel. The Excel file containing all the methods can be downloaded for free. Comment down with suggestions on what topics you want us to cover next. See you soon.