Alpha is calculated to compare a stock investment’s performance to the market’s or benchmark index’s performance. Imagine you want to buy a stock, but unsure about whether it will be a good investment or not. By calculating alpha, you will know the performance of that stock and be able to make a decision based on it.
In this article, we will learn how to calculate alpha in Excel. You will be able to understand how to use the stock data you have to find out the performance of that stock against the market’s performance.
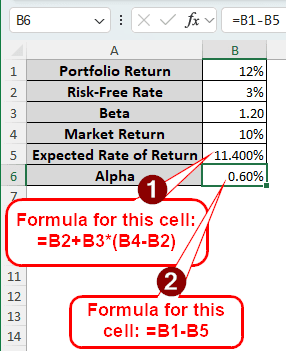
➤ Calculate the expected rate of return using the following formula: =B2+B3*(B4-B2)
➤ Replace B2 with the risk-free rate of return, B3 with the beta, and B4 with the market return.
➤ Calculate Alpha using the formula below:
=B1-B5
➤ Replace B1 with the portfolio return and B5 with the expected rate of return.
That method will work for you if you have the portfolio return and market return for a single day. However, if you want to calculate alpha for multiple days, you would have to deal with several data points. In this article, we will learn methods for both single returns and historical data. Therefore, read the whole tutorial, and consider downloading the Excel file so that you can follow along.
What is Alpha in Finance?
In finance, alpha is used to measure how a stock performs relative to the benchmark index. When the value of alpha is positive, it indicates that the stock is outperforming the benchmark/market. Similarly, a negative alpha indicates that the stock is underperforming. Having exactly zero alpha suggests that the investment is performing on par with the market.
Calculating Alpha with Single Portfolio & Market Returns
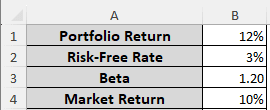
In the simplest form, alpha can be calculated with four metrics in hand. You will need the portfolio return, the risk-free return of return, the beta, and the market return. With these data, you can calculate the expected rate of return and the alpha. Here is how to do it:
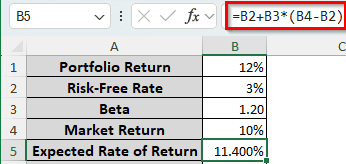
➤ We are going to calculate the expected rate of return in the B5 cell. Write the following formula in that cell:
=B2+B3*(B4-B2)
➤ Press Enter to get the result.
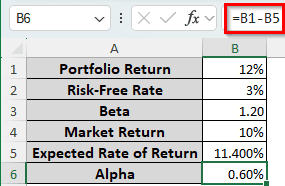
➤ Use the following formula to calculate the alpha:
=B1-B5
Finding the Alpha from Historical Data
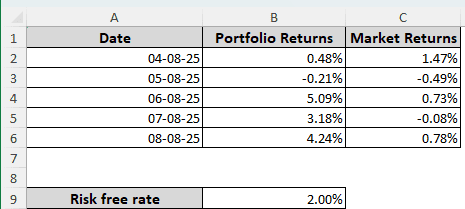
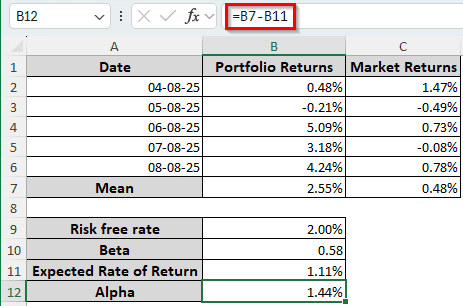
For this method, we have the portfolio and market returns for a week (except the holidays). We will have to calculate the beta, expected rate of return, and alpha from this dataset. Let’s begin:
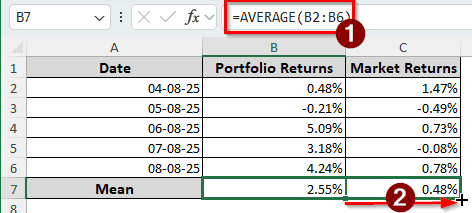
➤ As there are multiple portfolio returns and market returns, we cannot work with those values directly. Instead, we will have to calculate their average and use those values. In B7 and C7 cells, we will calculate the mean of those returns. Insert the following formula in the B7 cell:
=AVERAGE(B2:B6)
➤ Find the small plus (+) sign at the bottom right corner of the B7 cell, and drag it to the C7 cell to autofill. This will calculate the mean of market returns as well.
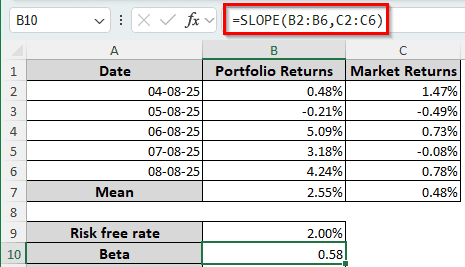
➤ In the B10 cell, calculate the beta using the following formula:
=SLOPE(B2:B6,C2:C6)
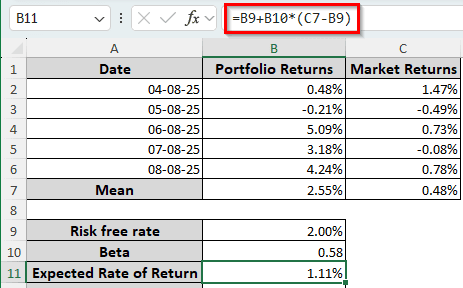
➤ Now, we have to calculate the expected rate of return using the formula below:
=B9+B10*(C7-B9)
➤ Finally, put the following formula in the B12 cell to calculate the alpha:
=B7-B11
Frequently Asked Questions
What is the formula for calculating alpha?
The formula for calculating alpha manually is as follows:
Alpha = R – Rf – beta(Rm – Rf)
Here, R is the portfolio return, Rf is the risk-free rate of return, and Rm is the market rate. Putting this into Excel, the formula will look like the following:
=B1-B2-B3*(B4-B2)
In this formula, B1 should be replaced by R, B2 should be replaced by Rf, B3 should be replaced by beta, and Rm should be replaced by B4.
How do you write alpha in Excel?
To insert the alpha symbol in Excel, you can use a keyboard shortcut. Press and hold the Alt key, and type 224 on the numeric keypad (numpad) of your keyboard. The alpha (α) symbol will be written.
How is alpha written?
Alpha is written using the Greek symbol α. The Unicode value of this symbol is U+03B1. However, if you want to write it in capital letters, you can just use A instead.
What is 1 alpha?
An alpha value of 1.0 means that the stock you have calculated the alpha value for has outperformed the market returns/benchmark index by 1%. A higher value will indicate more outperformance, and a lower value will indicate underperformance.
Can alpha be zero?
Yes, but it’s highly unlikely. A zero value of alpha would imply that it has the same returns as the benchmark index. That does not happen in general; stocks usually vary with the benchmark index.
Wrapping Up
In this article, we have learned how to calculate alpha in Excel. We hope that you understood the methods we used in this article. If you have any questions, don’t forget to ask them below. In case you don’t have any questions, comment down what topic you want us to make a tutorial about in the future. Consider bookmarking this site so that you can visit it later for more Excel tutorials like this.