In order to understand the condition of a stock in the market, it is essential to calculate beta. As an investor, you might want to assess the risk of the potential investment you are going to make to make an informed decision. Fortunately, it is easy to calculate beta in Excel.
In this article, we will show you the methods you can use to calculate beta in Excel. We will learn how to get data for doing the calculation, how to do the analysis, and more. After reading the article, you will have a sound knowledge of calculating beta in Excel.
➤ Take the closing prices of your preferred stock and the value of the S&P 500.
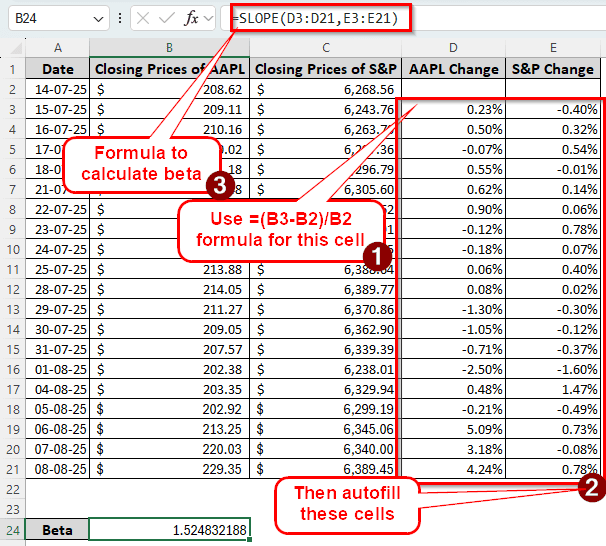
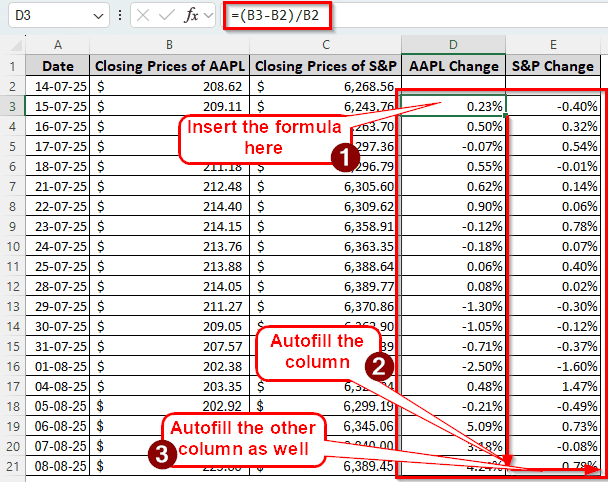
➤ Calculate the price changes using this formula: =(B3-B2)/B2
➤ Replace B3 with the newer price and B2 with the older price, then do it for all of the days except the first one.
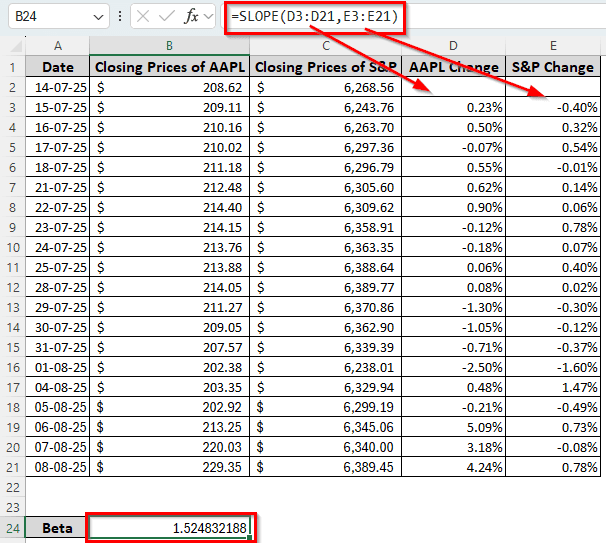
➤ Calculate the beta using the following formula: =SLOPE(D3:D21,E3:E21)
➤ Replace D3:D21 with the changes of one stock, and E3:E21 with the changes of another stock.
That was a bunch of steps to follow, and it might be quite confusing. Not to worry, because we have that method, along with some other methods to calculate beta, explained in detail in this article. Therefore, read the whole tutorial to get a good grasp of it.
What is Beta in Finance?
Beta is a financial metric that you can use to find the volatility of one stock against the market. It finds the risk of a stock against the market to use in the capital asset pricing model. When Beta is 1, that means the stock has average risks. When the beta is bigger than 1, the risk is higher, and the market is more volatile. When the beta is smaller than 1, the risk is lower.
Calculating Beta in Excel
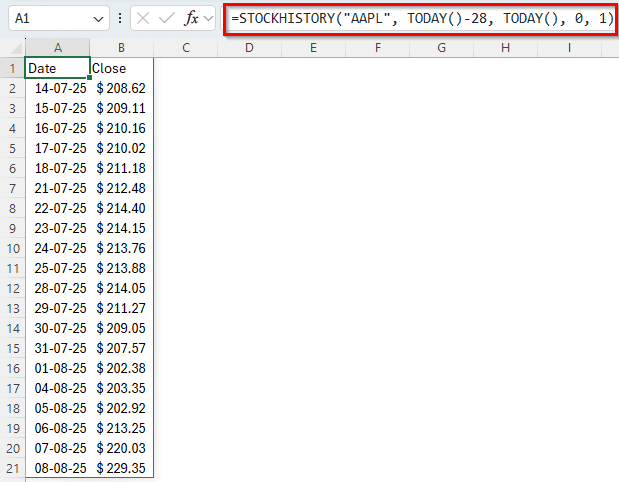
In this article, we will be calculating the beta of AAPL (Apple). Let’s gather the financial history of AAPL first using Excel’s built-in tools. Remember, you must be signed into Microsoft 365 to do this. Using LTSC versions of Office might not work.
➤ Write the following formula in the A1 cell of a new sheet.
=STOCKHISTORY("AAPL", TODAY()-28, TODAY(), 0, 1)
➤ Now, in the C1 cell, do the same for S&P 500.
=STOCKHISTORY("S&P 500", TODAY()-28, TODAY(), 0, 1)
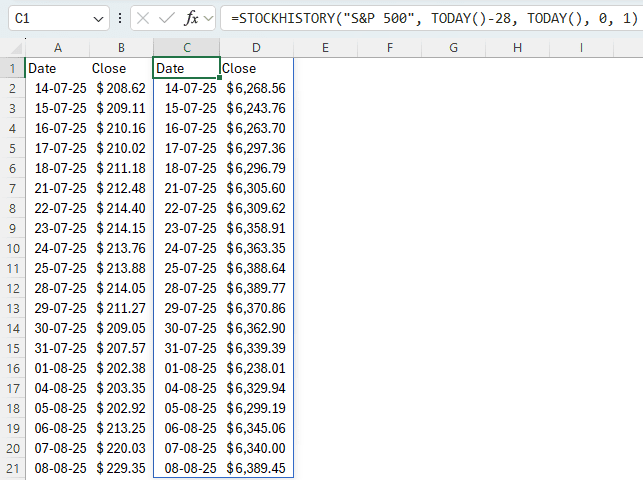
➤ You might notice that although we have asked for 28 days of data, only 20 rows are filled. That’s because the holidays are excluded from the calculation.
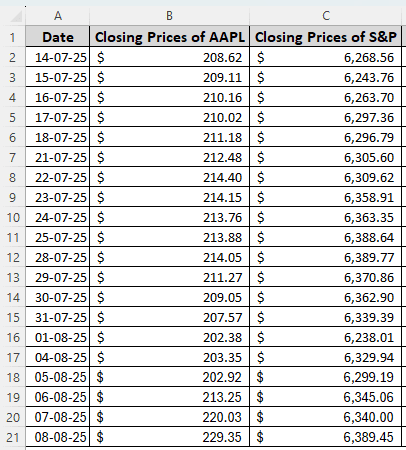
➤ Go to a new sheet, and copy and paste the data from this sheet to that. Use a Date column, a column for the Closing Prices of AAPL, and another column for the Closing Prices of S&P.
➤ Now, the changes of those stocks need to be calculated. Create two more columns for AAPL Change and S&P Change. Write the following formula in the D3 cell:
=(B3-B2)/B2
➤ Autofill the rest of the column, and the E column as well.
Now that the data has been prepared, let’s calculate beta from this data.
Calculating Beta Using the SLOPE Function
Excel provides a bunch of functions that can be used to calculate beta. For this method, we will be using the SLOPE function. Follow the steps below:
➤ Write the following formula in the desired cell:
=SLOPE(D3:D21,E3:E21)
➤ Press Enter to see the result.
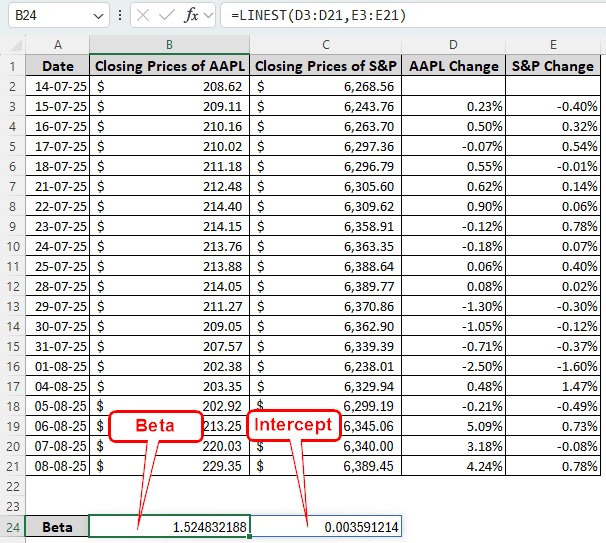
Making Use of the LINEST Function to Calculate Beta
The LINEST function is usually used to find the linear changes of two sets of data. We can easily apply this function in Excel to find the beta. Follow the steps below:
➤ Insert the following function in the target cell:
=LINEST(D3:D19,E3:E19)
➤ There will be two outputs for this function. The first one is the beta, and the second one is the intercept.
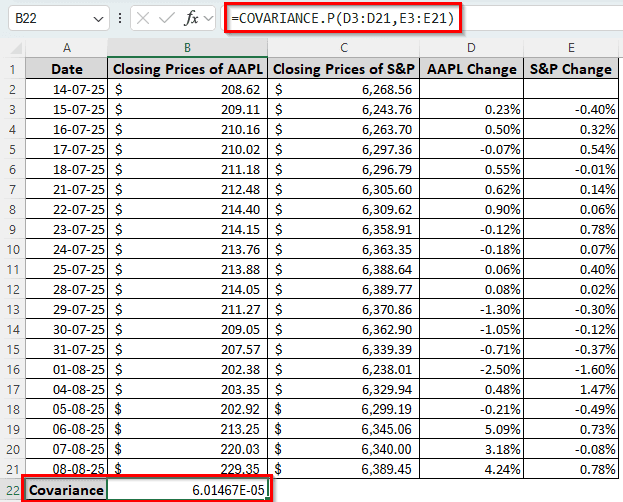
Combining COVARIANCE.P and VAR.P to Calculate Beta
The COVARIANCE.P and VAR.P functions are used to calculate the covariance and variance of datasets. We can use these functions and divide the covariance by the variance to calculate beta. Here is how to do it:
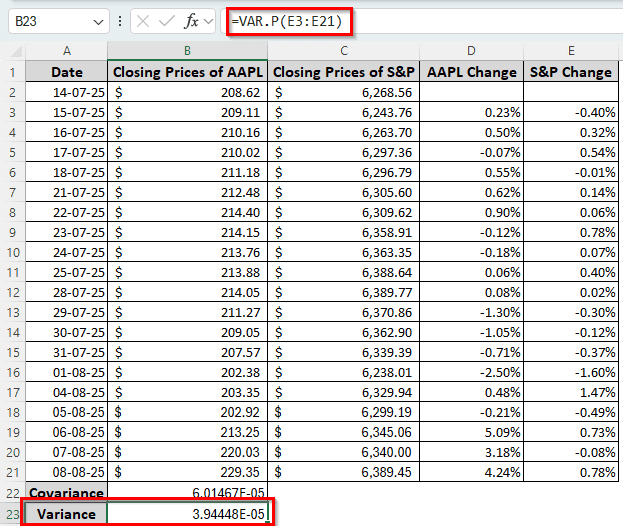
➤ Use the following formula to calculate the covariance:
=COVARIANCE.P(D3:D21,E3:E21)
➤ Use the formula mentioned below to calculate the variance:
=VAR.P(E3:E21)
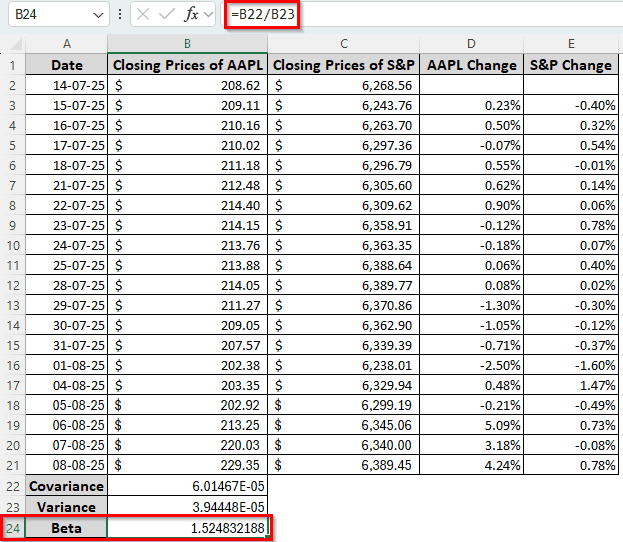
➤ Enter the formula below to calculate the beta:
=B22/B23
Using Regression Analysis to Calculate Beta
We can use regression analysis to generate a full report of the regression statistics, which will contain the beta. The steps to do this are as follows:
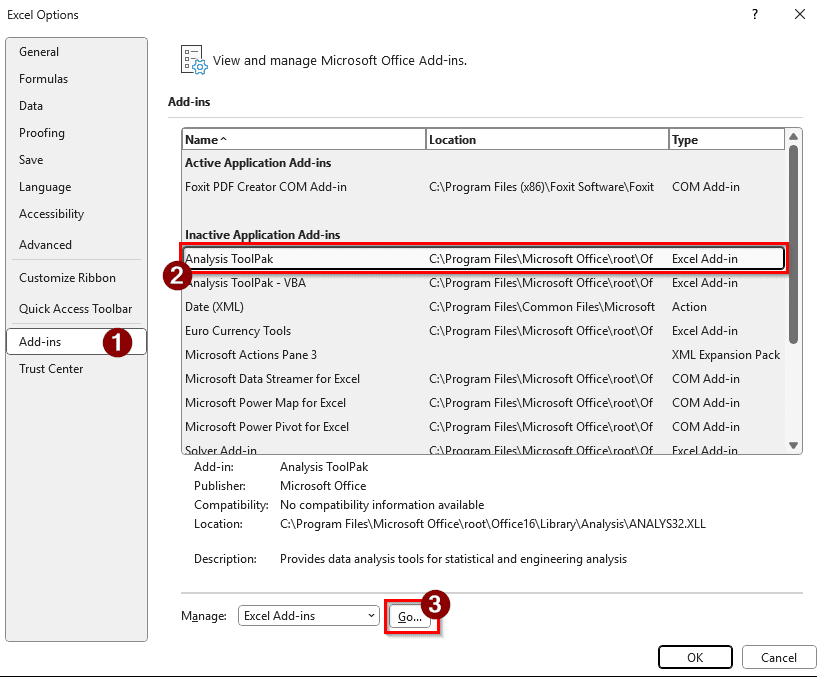
➤ First, we need to enable regression analysis from the Excel settings. From the Excel window, go to File > Options.
➤ A new window will appear. Go to Add-ins from the left panel, and select Analysis Toolpak from the right. If it is already in the Active Application Add-ins section, then you don’t have to worry. If it isn’t, select Go from the bottom.
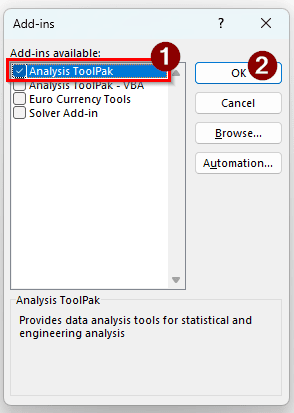
➤ Tick the Analysis ToolPak option and hit OK.
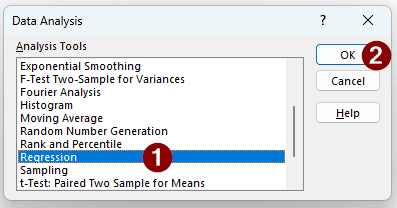
➤ Get back to your Excel sheet. From the Data tab, select Data Analysis from the Analysis section.
➤ Select Regression from the Data Analysis window and hit OK.
➤ Insert $D$3:$D$21 in the Input Y Range, $E$3:$E$21 in the Input X Range, and $G$1 for the Output Range.
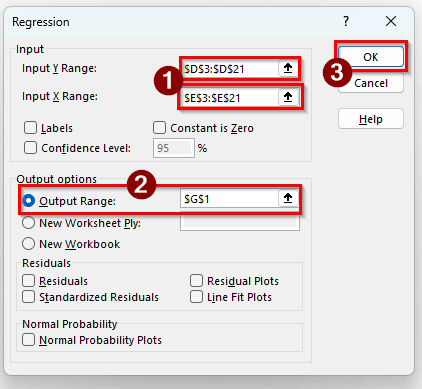
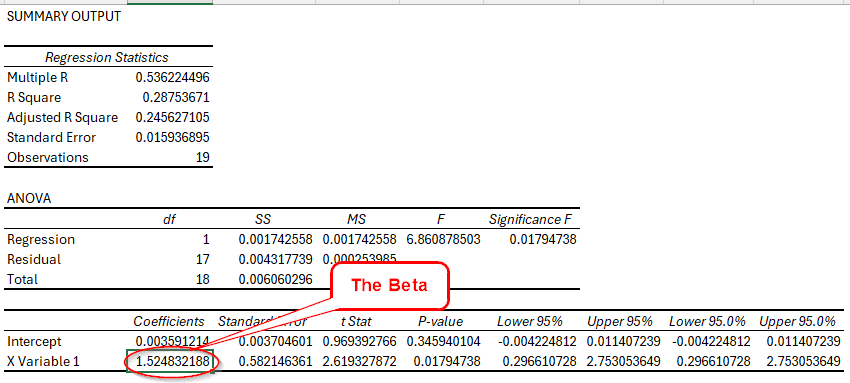
➤ Press OK. A SUMMARY OUTPUT will be generated. In that, the beta will be in the Coefficients column and the X Variable 1 row.
Frequently Asked Questions
How do you calculate β?
The simplest method to calculate beta manually is to divide the covariance by the variance. The formula in Excel would be like the following:
=A1/B1
Provided that A1 contains the covariance, and B1 has the variance.
Can beta be negative?
Yes, but it won’t in most cases. A negative beta means that the stock has an inverse relation with the market, which is practically impossible. However, gold and gold stocks can somehow have a negative beta.
What is a good beta?
If the beta is less than 1.0, it is considered good. It means that the stock is less volatile than the market, and you would get a stable return. However, if you aren’t afraid of risks and ready to accept bigger losses and bigger returns, beta values bigger than 1.0 might be better for you.
What is the range of beta?
Beta can range from less than zero (Beta<0) to more than 1 (Beta>1). A zero beta indicates that there is no correlation with the market, and 1 matches the volatility of the market.
Is a beta of 0.5 good?
A beta of 0.5 is lower than 1, which indicates that the risk of the stock is low and it’s not particularly volatile. Investing in this stock will give you more stable returns than others.
Wrapping Up
In this article, we learned how to calculate beta in Excel using four different methods. We also learned how to gather data for beta calculation and how beta works in general. If you have any questions, feel free to ask them in the comments. Download the worksheet we used in this article to practice the methods better. We will see you in another tutorial.