A common statistical problem in social research, science, and business is comparing the means of different groups. One way ANOVA (Analysis of Variance) is a useful tool for comparing consumer satisfaction across product lines, evaluating the effect of various fertilizers on crop yield, measuring sales success across regions, etc. In this tutorial, you’ll learn about one way ANOVA and how to do one way ANOVA in Excel. Additionally, you will also learn to interpret the significance of the results of your one way ANOVA test.
➤ One way ANOVA determines any significant difference in the mean of multiple groups In this article, we’ll learn about one way ANOVA, how to perform this test using the Data Analysis ToolPak and understand the significance of the test results.
➤ Enable Data Analysis: File >> Options >> Excel Add-ins >> Data Analysis
➤ One way ANOVA: Data tab >> Data Analysis >> ANOVA: Single Factor >> Input range >> Output range >> OK
➤ If F statistic > F critical, reject the null hypothesis and vice versa
➤ If the P value < significance level, reject the null hypothesis and vice versa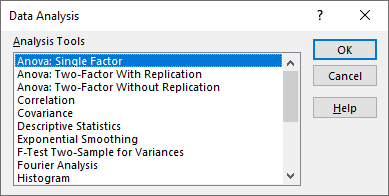
What is One way ANOVA?
One way ANOVA determines if there is any significant difference between the average of three or more groups. In Excel, one way ANOVA is called Single Factor ANOVA. Like other hypothesis tests, one way ANOVA uses sample data to draw conclusions about the entire population. Categorical variables like various products, places, treatments, etc. are independent variables. While continuous measurements like sales, output, or satisfaction ratings, etc. are dependent variables.
The one way ANOVA test has the following hypotheses:
- Null hypothesis: The group means are the same
- Alternate hypothesis: There is a difference between the group means
We can reject the null hypothesis and conclude there is a difference in the group means if the p value is below 0.05.
Performing One Way ANOVA Test in Excel
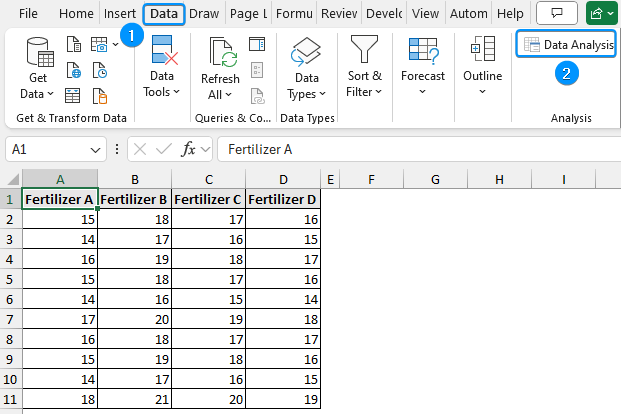
In this dataset, we compare plant growth (in cm) with four different types of fertilizer. We have 10 samples for each fertilizer and want to determine whether the mean plant growths differ using the four fertilizers.
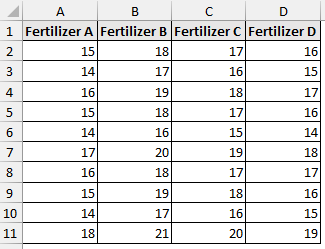
Suppose an agricultural scientist wants to know whether crop yields vary depending on the type of fertilizer used. By performing a one way ANOVA in Excel, the scientist can determine if the observed yield varies due to the type of fertilizer or due to some other random variation.
Once your data is organized, it’s easy to run a one way ANOVA in Excel. The Data Analysis ToolPak add in provides a quick way to run the test and automatically generate an output table.
You must enable the Data Analysis Toolpak to perform the one way ANOVA test. You’ll find this option in the Data tab. If not, follow these steps:
Steps:
➤ Click on the File tab.
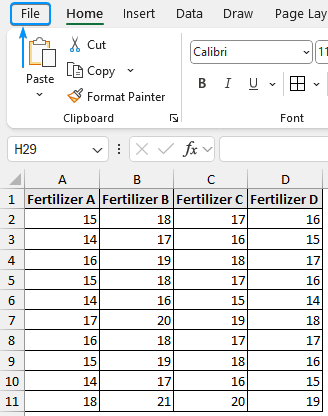
➤ Select Options. You can also use the shortcut Alt + F + T to open Excel Options.

➤ Select Add-ins >> Choose Excel Add-ins from the dropdown >> Go.
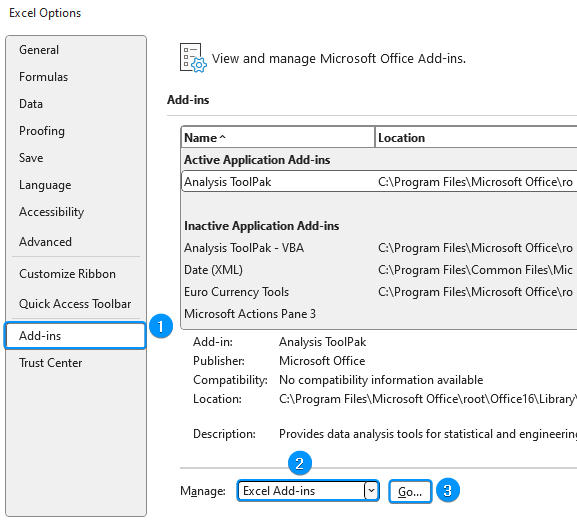
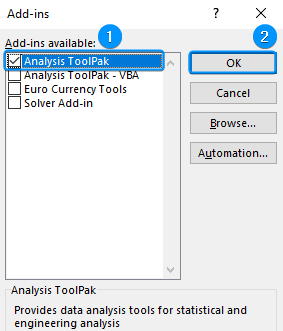
➤ Check the Analysis ToolPak option >> OK.
The Data Analysis ToolPak will be available in the Data tab whenever you open a new workbook.
➤ Go to the Data tab >> Click Data Analysis.
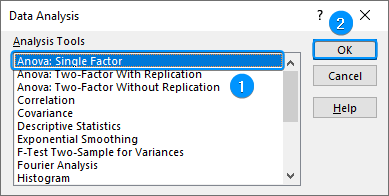
➤ Select ANOVA: Single Factor >> OK.
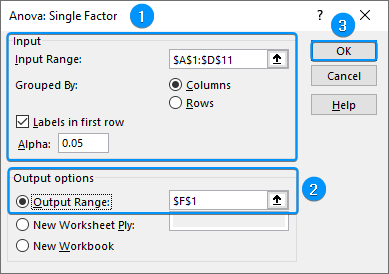
➤ Select the input range (A1:D11) >> Grouped By: Columns >> Check Labels in first row >> Keep the default significance level (Alpha: 0.05).
➤ Choose the output cell (F1) >> OK.
➤ You’ll get the result shown below.
Interpreting One Way ANOVA Test Results
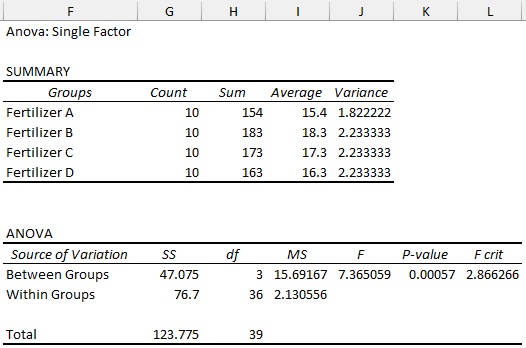
➥ In the Summary table, the average growths for each fertilizer are different. However, we need the ANOVA table to determine if these differences are significant.
➥ The F statistic is greater than the F critical value (7.365059>2.866266). Reject the null hypothesis. The four means are not the same, at least one of the means is different.
➥ The P value (0.00057) is less than the significance level (0.05). Therefore, reject the null hypothesis. There is significant evidence that the four means are not the same.
Note: The one way ANOVA test does not tell you which groups significantly differ from others. If the one way ANOVA is significant, perform post hoc tests.
Frequently Asked Questions
When to use the one way ANOVA test?
- Comparing the means of multiple independent groups.
- One independent categorical variable influencing a continuous dependent variable.
How to perform a one way ANOVA test in Excel?
- Enable Data Analysis: File >> Options >> Excel Add-ins >> Data Analysis.
- One way ANOVA: Data tab >> Data Analysis >> ANOVA: Single Factor >> Input range >> Output range >> OK.
How to read one way ANOVA test results?
Check the F statistic:
- If F statistic > F critical, reject the null hypothesis.
- If F statistic< F critical, cannot reject the null hypothesis.
Check the P value:
- If the P value < significance level, reject the null hypothesis.
- If the P value > significance level, cannot reject the null hypothesis.
How do I set up my data for one way ANOVA in Excel?
Each group should be in a separate column, where each row represents an observation within that group.
Wrapping Up
In this tutorial, we’ve learned about what one way ANOVA is, how to do a one way ANOVA test in Excel using the Data Analysis ToolPak, discussed the test results and their significance. Feel free to download the practice file and let us know which method you like the most.