Logistic regression is one of the most effective tools for analyzing binary outcomes, such as forecasting whether a consumer will purchase a product (Yes/No) or if a student will pass an exam (Pass/Fail). Although Excel does not have a built in function for logistic regression, you can use add-ins to perform logistic regression. This is a step by step guide on how to do logistic regression in Excel. Upon completion, you will understand the impact of the independent variables on a binary dependent variable and predict probabilities.
➤ Logistic regression relates multiple independent variables and a binary dependent variable. In this article, we’ll learn about logistic regression and how to perform logistic regression in Excel using the Solver Add-in.
➤ The initial coefficient values are chosen arbitrarily.
➤ Logit, n: =c0+(c1*Income)+(c2*Credit Score)+(c3*Loan Amount)
➤ Exponent: =en
➤ P(n): =IF(dependent variable outcome=1,en/(1+en),1-(en/(1+en)))
➤ Log likelihood: =LN(P(n))
➤ Enable Solver: File >> Options >> Excel Add-ins >> Solver Add-in
➤ Solver: Data tab >> Analysis >> Solver >> Objective >> To >> Changing variable cells >> Uncheck make unconstrained variables non-negative >> GRG Nonlinear >> Solve
➤ The resulting coefficients are the solution to y=1. Just reverse the signs for the solution to y=0.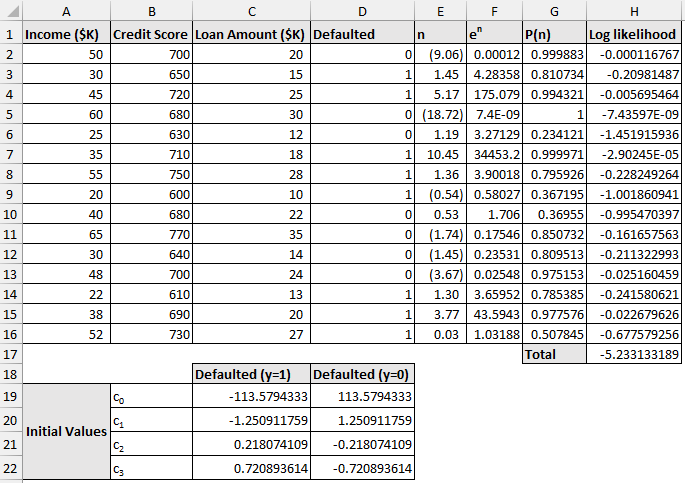
What Is Logistic Regression in Statistics?
Logistic regression models the relationship between a set of independent variables (predictors) and a binary dependent variable (outcome) that can take only two possible values, such as “yes” or “no”, “pass” or “fail”, or “1” and “0”.
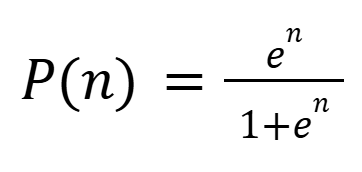
Instead of fitting a line, as in linear regression, logistic regression uses the logistic function to model the probability that an event will occur. The mathematical expression is given below:
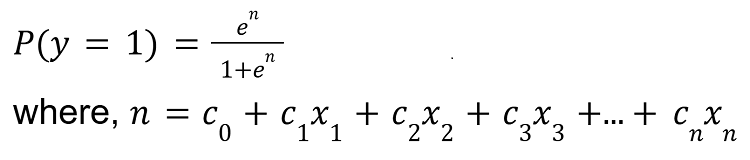
where,
- P(y) is the probability of success (y=1) or failure (y=0)
- c0 is the intercept
- c1, c2, c3 are the coefficients
- x1, x2, x3 are the independent variables
Steps for Performing Logistic Regression in Excel
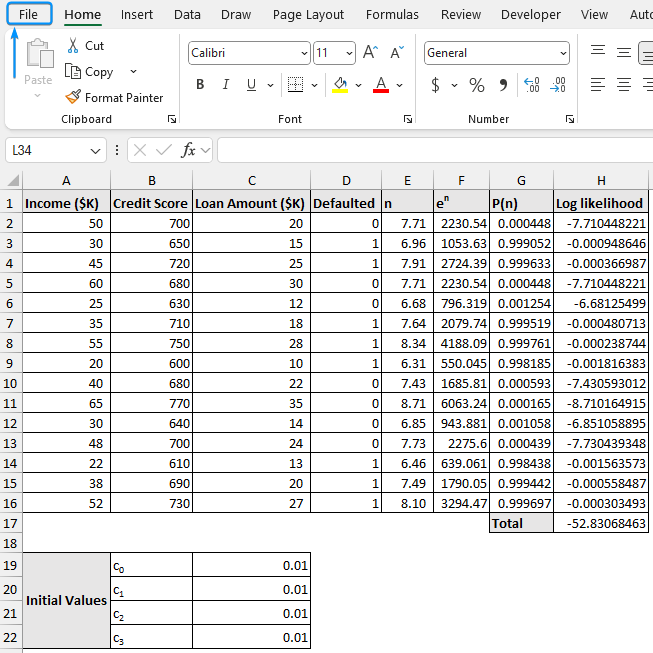
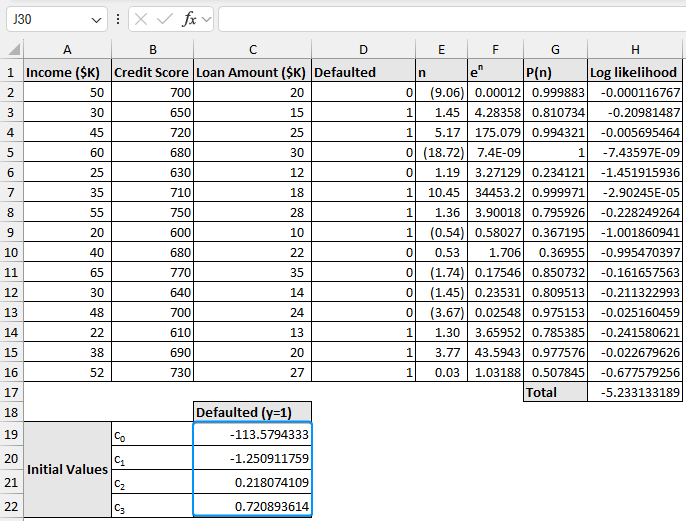
Consider the loan default dataset containing the income, credit score, loan amount, and defaulted (Yes or No) in columns A through D.
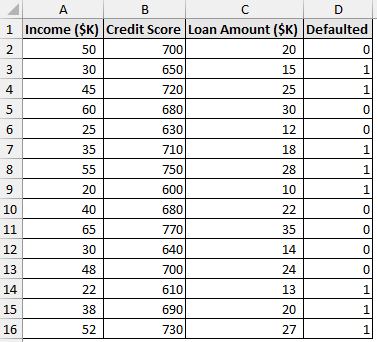
Here, the independent variables are the income, credit score, and the loan amount. The Defaulted is the dependent variable, where 1 represents yes (defaulted) and 0 means no (not defaulted).
Let’s use the above dataset to model how income, credit score, and loan amount affect the chance of a default. Our objective is to determine the logistic regression equation that best predicts default based on the other factors.
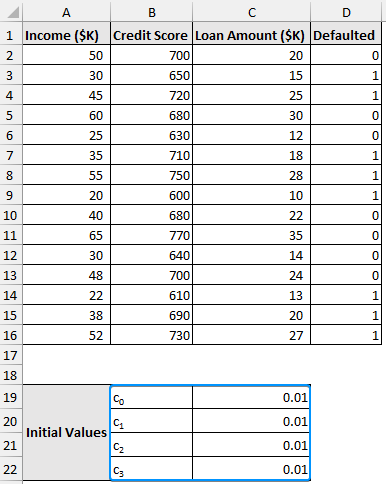
Step 1: Choosing Arbitrary Values for the Coefficients
➤ Choose arbitrary values for the c0, c1, c2, and c3 coefficients. For instance, we’ve set all the values to 0.01. Excel’s Solver Add-in will optimize these values later on.
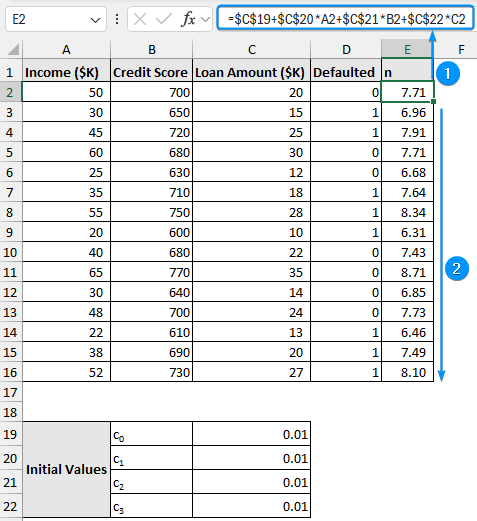
Step 2: Calculating Logit (n) and Exponential (en)
➤ You’ll need to construct a few columns to perform the logistic regression. In the calculation, we’ve defined Logit as n. The formula for Logit is given below.

➤ Select the output cell (E2) and enter the formula. Use the Fill Handle tool to copy the formula.
=$C$19+$C$20*A2+$C$21*B2+$C$22*C2
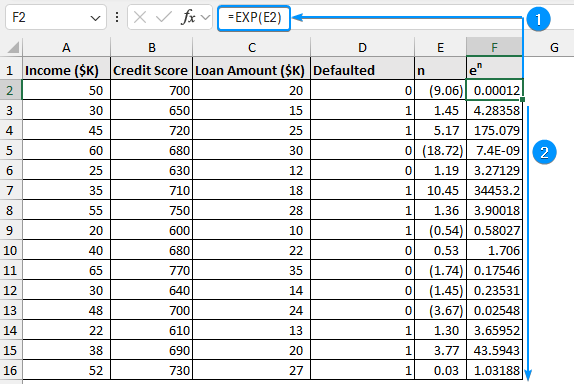
➤ Calculate the values for en and copy the formula to the cells below.
=EXP(E2)
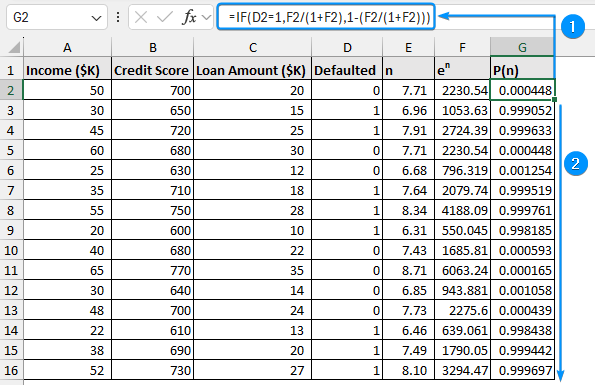
Step 3: Determining the Probability and Natural Logarithm of an Event
➤ The formula below gives the probability that event n will occur.
➤ Apply the formula to get the probabilities and autofill the cells below.
=IF(D2=1,F2/(1+F2),1-(F2/(1+F2)))
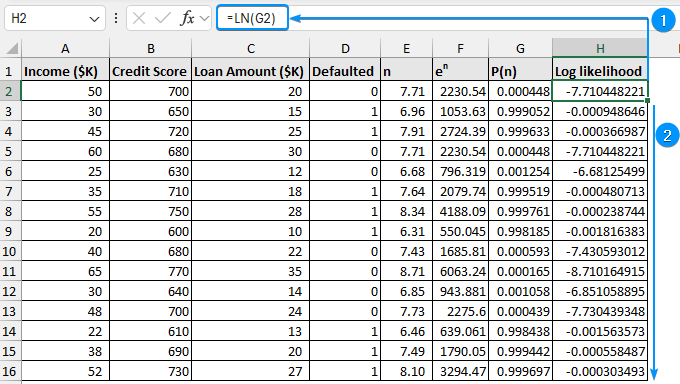
➤ The log likelihood represents the natural logarithm of the probability.
=LN(G2)
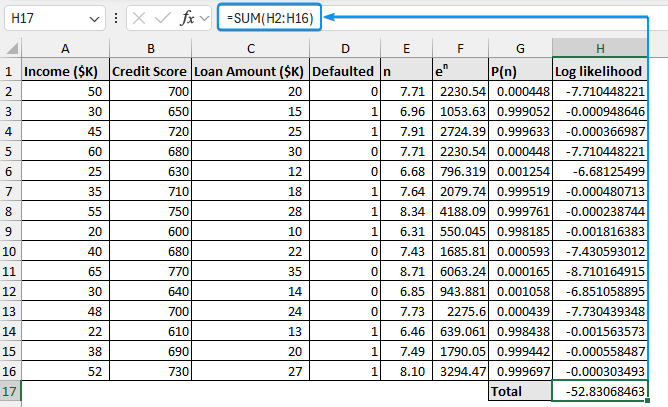
➤ Use the SUM function to calculate the total log likelihood.
=SUM(H2:H16)
Step 4: Activating Excel’s Solver Add-in
Now let’s use the Solver Add-in to perform the logistic regression in Excel. Note that you must activate the Solver Add-in before use. Follow these steps to activate this tool.
➤ Click on the File tab.
➤ Select Options. You can also use the shortcut Alt + F + T to open Excel Options.

➤ Select Add-ins >> Choose Excel Add-ins from the dropdown >> Go.
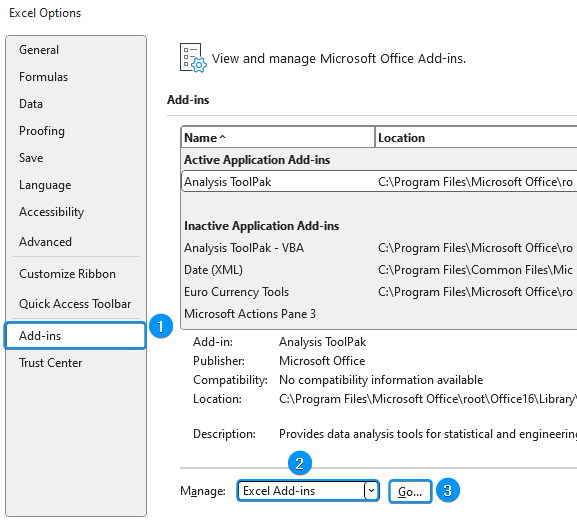
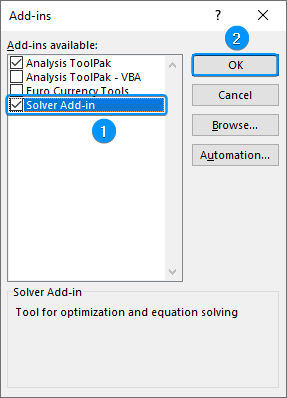
➤ Check the Solver Add-in option >> OK.
Step 5: Calculating the Coefficients with Solver Add-in
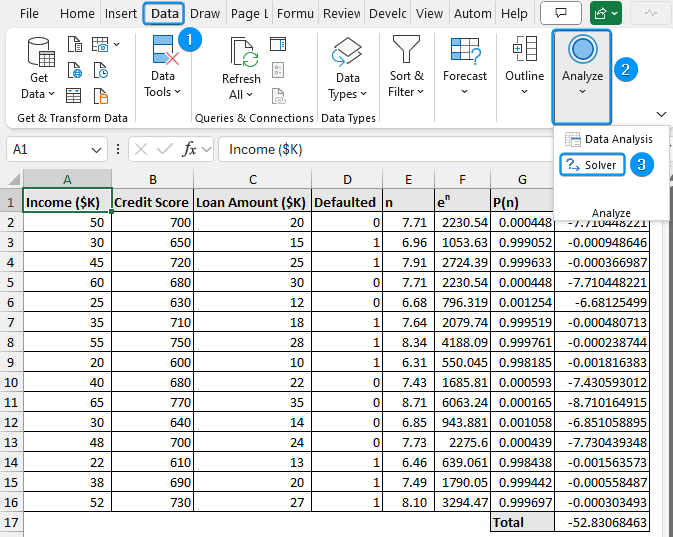
The Solver Add-in will be available in the Data tab whenever you open a new workbook.
➤ Go to the Data tab >> Analyze >> Solver.
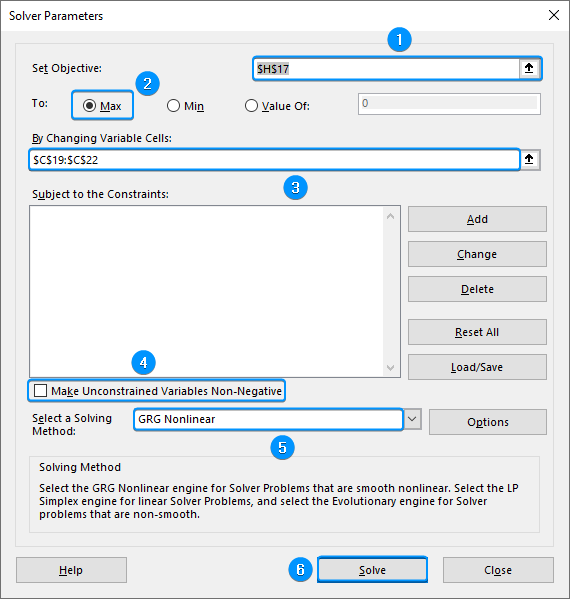
➤ Set Objective: Select the H17 cell containing the sum of log likelihoods
➤ To: Max
➤ By Changing Variable Cells: Choose the regression coefficients in C19:C22
➤ Make Unconstrained Variables Non-Negative: Uncheck this option
➤ Select a Solving Method: GRG Nonlinear
➤ Solve
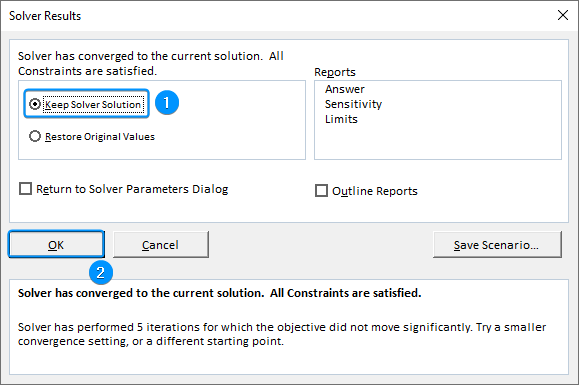
➤ Keep Solver Solution >> OK.
➤ These are the coefficients for the solution y=1 (success).
- c0 = -113.58
- c1 = -1.251
- c2 = 0.2181
- c3 = 0.7209
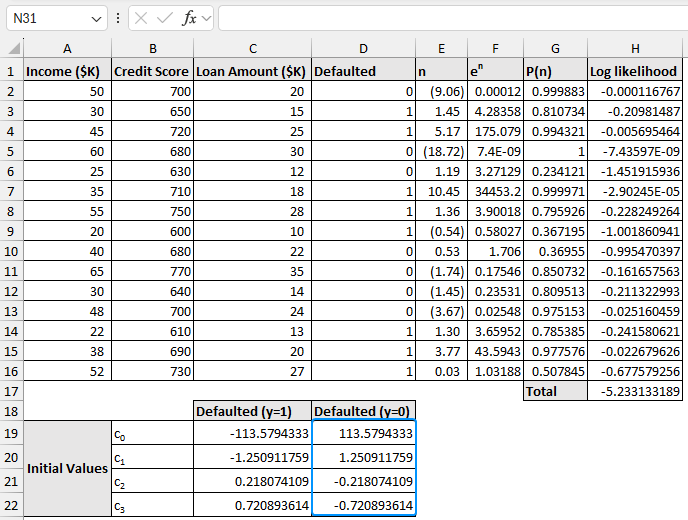
➤ For the solution of y=0 (failure), just reverse the signs of the coefficients, i.e.
- c0 = 113.58
- c1 = 1.251
- c2 = -0.2181
- c3 = -0.7209
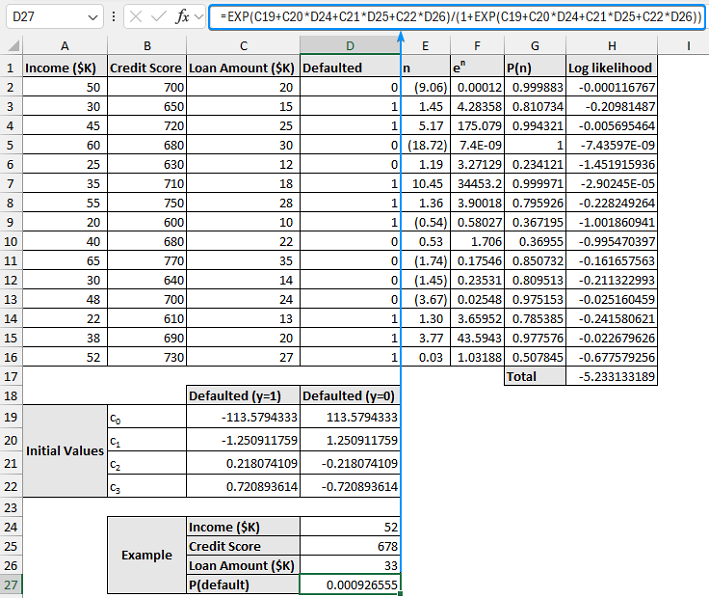
➤ For example, the probability that a borrower with an income of $52K, a credit score of 678, and a loan amount of $33k will default is:
=EXP(C19+C20*D24+C21*D25+C22*D26)/(1+EXP(C19+C20*D24+C21*D25+C22*D26))
Since the probability is close to zero, the model predicts that this borrower is unlikely to default on the loan.
Frequently Asked Questions
What is logistic regression, and when should I use it?
Logistic regression models the relationship between multiple independent variables and a binary dependent variable. You can use logistic regression when the dependent variable can take only two possible values, like “yes” or “no”, “pass” or “fail”, or “1” and “0”.
What is the formula for logistic regression?
The formula for logistic regression models the probability of the binary dependent variable as:
P(n) = en / (1 + en) where n = c0+c1x1+c2x2+c3x3+…+cnxn
What are common errors when performing logistic regression in Excel?
- Solver not converging: This can occur if initial guesses for coefficients are far from the optimal values.
- Perfect separation: Logistic regression struggles when a predictor perfectly separates the outcome (e.g., all 1s or 0s for a range of predictor values).
- Small sample size: Logistic regression requires sufficient data to provide reliable estimates.
Wrapping Up
In this tutorial, we’ve learned about logistic regression and covered detailed steps on how to do logistic regression in Excel using the Solver Add-in. Feel free to download the practice file and share your thoughts with us.