Pivot Tables are one of the best tools for summarizing and analyzing data. However, when applying conditional formatting, blank cells get formatted. This can be visually distracting and misleading. ...
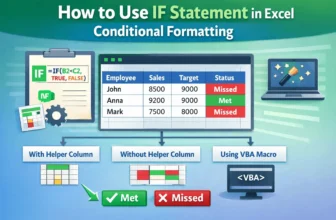
Combining the IF statement with Conditional Formatting in Excel allows users to create dynamic rules that automatically highlight cells based on logical conditions. With Excel’s built-in tools and ...
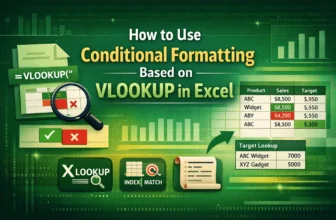
Combining Conditional Formatting with VLOOKUP function lets users dynamically highlight cells based on lookup results, making it easier to visually track matches. By using Excel’s built-in tools and ...
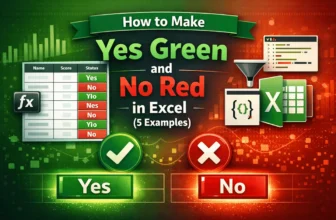
Highlighting “Yes” and “No” in Excel with different colours helps make datasets more readable and visually appealing. It is especially helpful for displaying datasets with repetitive values, where ...
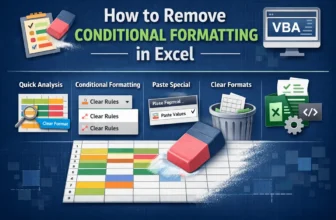
Conditional Formatting is a powerful Excel feature that highlights cells based on specific rules, making patterns and trends easier to spot. However, excessive formatting can clutter the worksheet ...
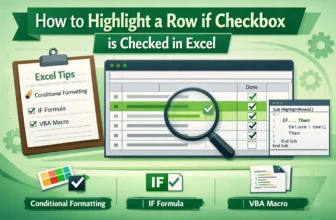
Conditional formatting is an effective Excel feature that visually enhances your data by applying color or style changes based on specific conditions. When combined with checkboxes, it becomes an ...
When managing tasks, projects, or data lists in Excel, it’s often helpful to visually identify rows that have been completed or selected. Highlighting an entire row based on a checkbox makes your ...
Tracking upcoming dates in Excel is essential for managing deadlines, events, and tasks efficiently. Conditional formatting allows you to automatically highlight dates that are approaching, saving ...
To highlight cells in a data range based on a date stored elsewhere in your sheet, you need to use a formula with an absolute reference (fixed with a dollar sign, $). Such formatting is used for ...