Sometimes we need the same data on different platforms while creating a presentation or a doc file. In that case, copying a chart from Google Sheets is highly beneficial as it allows you to see the same data without creating another chart from scratch, which is an easy presentation of data, visually appealing, and less chance of error as the data is linked in every workspace.
For instance, in the corporate office, giving a presentation on any data is quite a common practice. In that case, creating a chart from scratch with the data in a presentation slide is a time-consuming process. In that case, just copying the chart that already exists in Google Sheets helps to save some time, and as the data is linked, you can change the data in no time.
Also, you can copy and paste any chart from one page to another page in Google Sheets for better visualization.
Steps to copy a chart from Google Sheets:
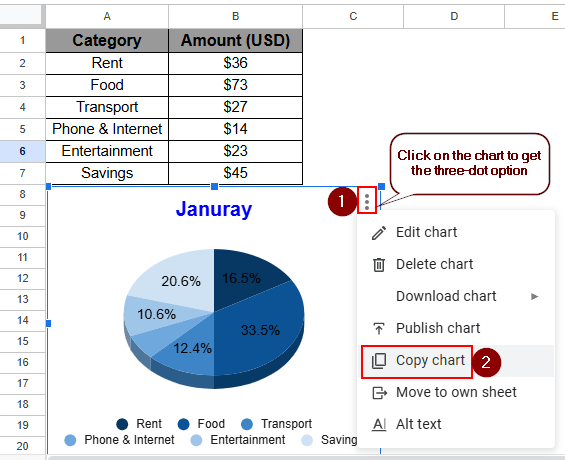
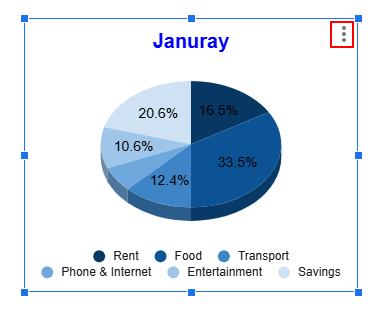
➤ Select the chart, and the three-dot option will be available in the top right side of the chart
➤ Select the Copy chart option to copy the chart and paste the chart into another spreadsheet or paste the chart into another workspace with the data linked.
In this article, we will learn how to copy a chart from Google Sheets. We will copy charts from one sheet to another sheet, or we can copy only the formatting. There is also another option, which is to copy the chart from a Google Sheet to another workspace, such as Google Docs, Google Slides, etc.
Copy a Chart from One Sheet to Another Sheet
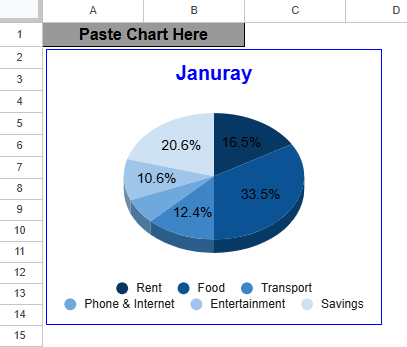
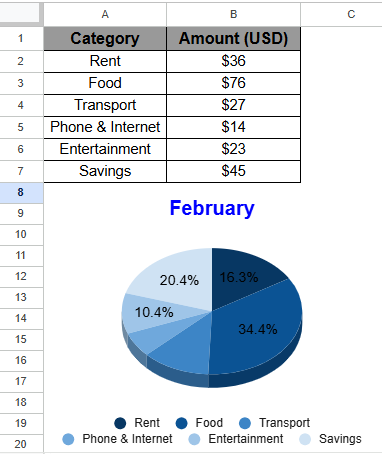
The dataset contains different categories of expenses of January, such as Rent, Food, Transport, etc and the amount of expenses in every category. After that, the data is inserted into a chart, and the pie chart shows the percentages of expenses according to the dataset. Now, we will copy the chart into another spreadsheet where all the charts of other months are pasted, and also copy the formatting to make all the charts the same.

Copy Entire Chart Including Formatting
We can copy a chart and paste it into another spreadsheet, applying the simple steps shown below.
Steps:
➤ Click on the chart, and in the top right corner, a three-dot option will be visible.
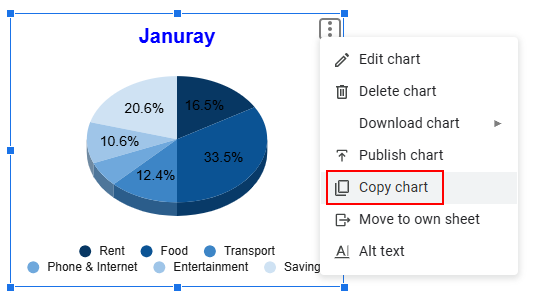
➤ Click on the three-dot and select the Copy Chart option from the drop-down menu or use the Ctrl + C shortcut.
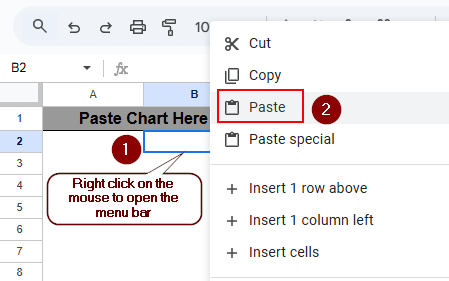
➤ Go to another spreadsheet and paste the chart by using the Ctrl + V shortcut or right-click on the mouse and select the Paste option.
➤ The output will be similar as below.
Copy and Paste the Chart Formatting Only
We can also copy the formatting of the chart with some edits to the chart. Follow the steps below to copy the formatting of the chart.
Steps:
➤ Initially, copy the chart from one spreadsheet and paste the chart into another spreadsheet, applying the Ctrl + C and Ctrl + V shortcuts.
➤ then, right-click on the three-dot option and select Edit chart option
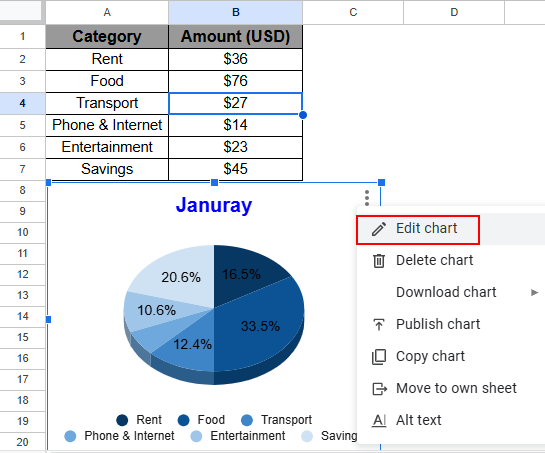
➤ The Chart Editor window will pop up, and select the Data range option as below.
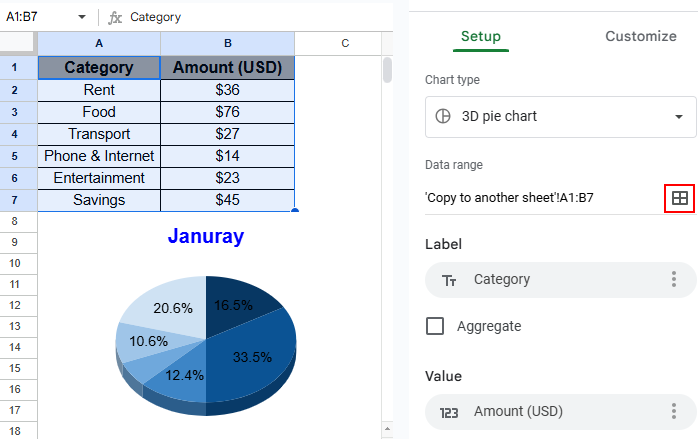
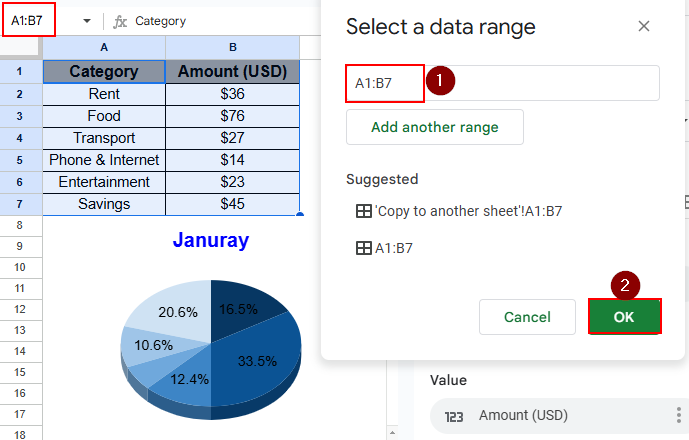
➤ Select a data range window will pop up and change the data, and click OK.
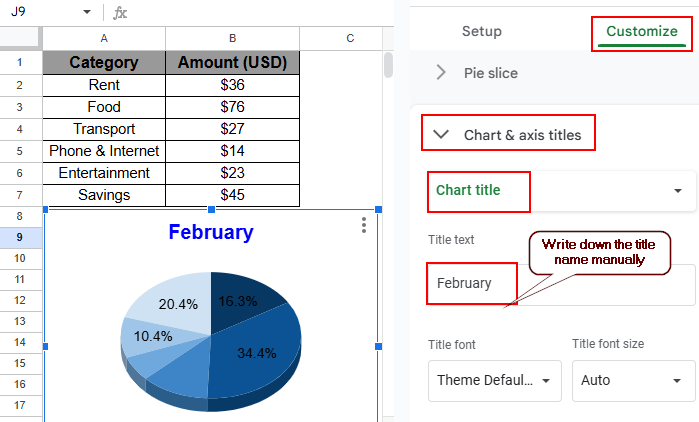
➤ Also, to change the chart name, go to Customize > Chart & axis titles > Chart title and write down the chart title manually in the Title text box.
➤ Here is the final output. The chart format is similar to the previous one yet the data is different from the previous one.
Copy a Chart from Google Sheet to Another Workspace
We can also copy and paste the chart into another workspace, such as Google Docs, Google Slides, etc. You can save the chart as an image and then paste it into another platform, or you can copy and paste it as a chart.
Copy the Chart in Another Workspace
Here we will copy the chart into another workspace. We use Google Docs, for example. The procedure will be the same for other workspaces as well.
Steps:
➤ Initially, copy the chart using the Ctrl + C shortcut or the regular way already shown in this article.
➤ Go to Google Docs to paste the chart. Apply the Ctrl + V shortcut to paste.
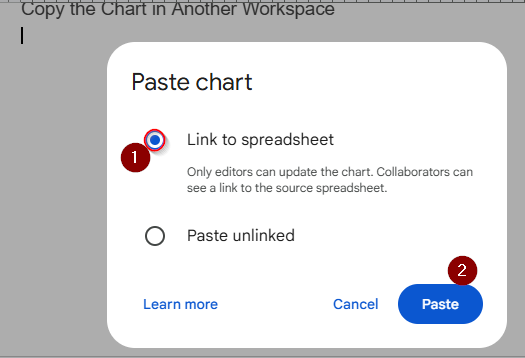
➤ Once the chart is pasted, the Paste chart window will pop up and select Link to spreadsheet to link the chart with data, and click on Paste to complete the process.
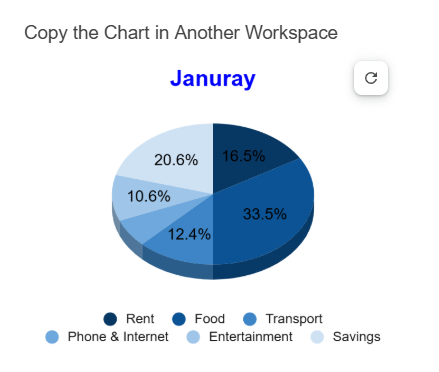
➤ The final output will be similar to below. The chart will be available in the doc.
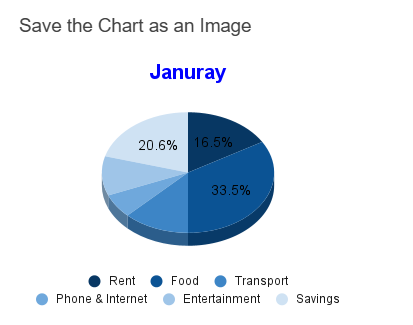
Save the Chart as an Image
Here, instead of copying the chart, we will download the chart as image and insert the image in another workspace. As the chart will convert into an image, the will not be linked to the data.
Steps:
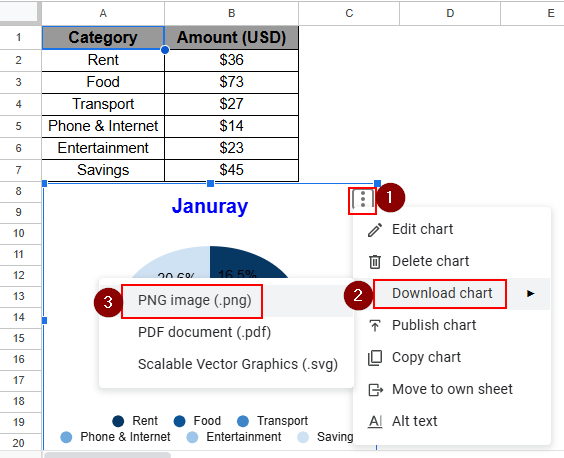
➤ First, select the chart and click on the three-dot option
➤ Go to Download chart > PNG image (.png) option to download the chart as an image.
➤ Now, go to the doc and click on Insert > Image > Upload from computer option
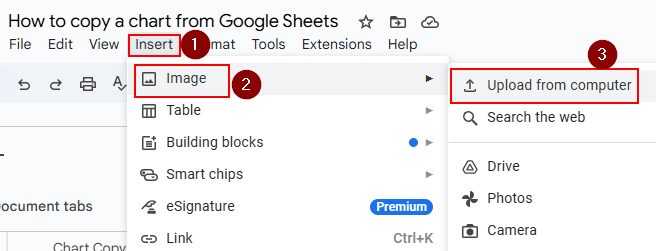
➤ Then, another window will pop up, select the downloaded image and click OK to insert the image in the doc file.
➤ The inserted chart will be available in the doc file as below.
Frequently Asked Questions
How do I copy a table from Google Sheets?
To copy a table, apply the “Duplicate table in workspace” option from the tab menu.
Select the table and click the Duplicate table in workspace option to complete the process.
How do I copy and paste a chart from Google Forms?
To copy and paste a chart from Google Forms:
➤ Open the form and click the Response option
➤ Click the Copy to clipboard to copy the chart
➤ Go to Google Docs and paste the chart by pressing Ctrl + V shortcut.
Can you copy and paste a chart from Google Sheets?
Yes, you can copy and paste a chart from Google Sheets in two ways. You can copy charts from one spreadsheet to another, or you can copy and paste the chart from Google Sheets to a different workspace.
How do I import a table from one Google sheet to another?
To import a table from one Google Sheet to another,
➤ Go to an empty sheet and apply the IMPORTRANGE function to import the data into that sheet.
➤ Write down ( =IMPORTRANGE and the URL of the sheet to import the sheet)
Wrapping Up
This article showed us how to copy a chart from Google Sheets. There are two options: you can copy and paste the chart from one spreadsheet to another spreadsheet, or you can also copy the chart to another workspace. Once you go through the full article, you will learn the possible way to copy charts, which is visually appealing and saves time, as well as the data is linked and connected.