It can be challenging to find the median for grouped data in Excel because there isn’t a built in function for it. To find the median for grouped data, follow specific steps and apply a formula. In this tutorial, you’ll learn about median for grouped data and how to find median for grouped data in Excel using two methods. By the end, you can use Excel to calculate the median for any grouped dataset easily.
➤ Median for grouped data divides the data into two equal parts. 50% of the observations are lower than the median value, while the other 50% are greater than the median value. In this article, we’ll learn about the median for grouped data and how to find median in Excel for grouped data using the manual method and with functions.
➤ To find median in Excel for grouped data:=cumulative frequency/2.=INDEX(cell_range,MATCH(cell_reference,cell_range,1)+1)=VALUE(LEFT(cell_reference,FIND("-", cell_reference)-1))=SUM(cell_range)/2=INDEX(cell_range,MATCH(cell_reference,cell_range,1))=INDEX(cell_range,MATCH(cell_reference,cell_range,1)+1)=RIGHT(cell_reference,FIND("-", cell_reference)-1)-LEFT(cell_reference,FIND("-", cell_reference)-1)=l+((n/2 - cf)/F)*h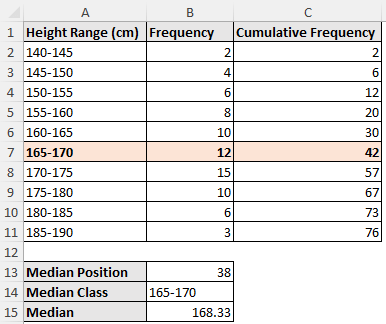
What Is Median for Grouped Data in Statistics?
Median for grouped data is the value that divides the data into two equal parts. Half of the observations are lower than the median value, while the other half are greater than the median value. Class intervals and frequencies are used to estimate the grouped median, instead of the individual data points.
The formula for calculating the median of grouped data is given below.

where,
➤ l is the lower boundary of the median class.
➤ n is the total number of observations.
➤ cf is the cumulative frequency of the interval before the median interval.
➤ F is the frequency of the median interval
➤ h is the class width.
Manual Calculation of Median for Grouped Data in Excel
Consider the student height (cm) dataset, which contains the height range and frequency in columns A and B.
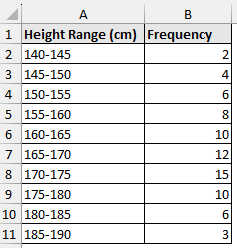
For example, we want to know the median height for the grouped data shown above. Just follow along.
The manual approach for calculating the grouped median is simple and suitable for learning, especially with small datasets.
Steps:
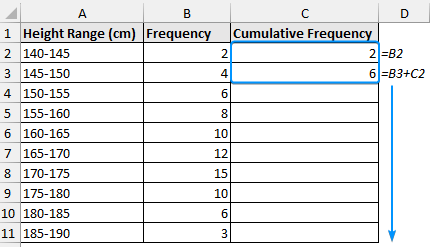
➤ Enter the formulas in cells C2 and C3 >> Drag the Fill Handle tool to get the cumulative frequency. The cumulative frequency will equal the summation of all the frequencies (76).
=B2
=B3+C2

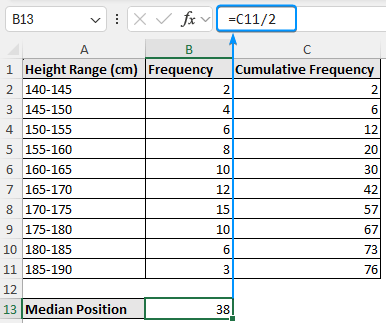
➤ The formula for the median position is total frequency divided by two (n/2).
=C11/2

➤ The median class is the interval where the cumulative frequency is just greater than or equal to the median position. For example, the cumulative frequency greater than or equal to the median position is 42, which lies in the interval 165-170.

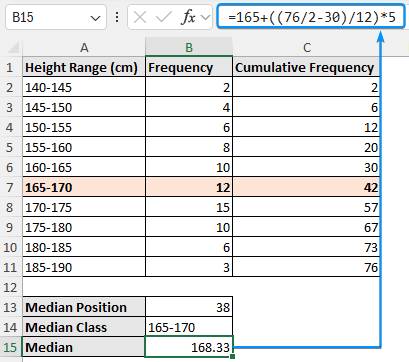
➤ Plug the values in the formula to get the median height of 168.33cm.
=165+((C11/2-C6)/B7)*5
Finding Median for Grouped Data with Functions
Once you’ve learned the calculation procedure, it’s time to use functions to make the calculations dynamic. In this approach, we’ll make the determination of the median for grouped data dynamic using functions. It is well suited for large datasets where manual calculation would take a lot of time and for minimizing errors.
Steps:
➤ Calculate the cumulative frequency as shown previously.
=B2
=B3+C2
➤ Determine the median position.
=C11/2
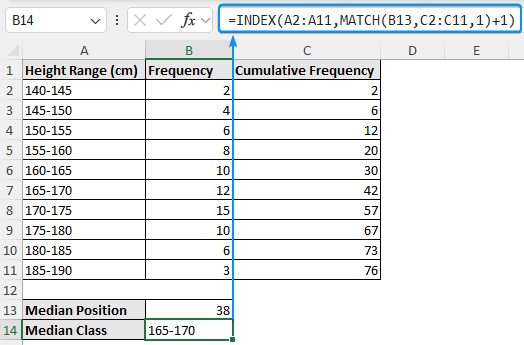
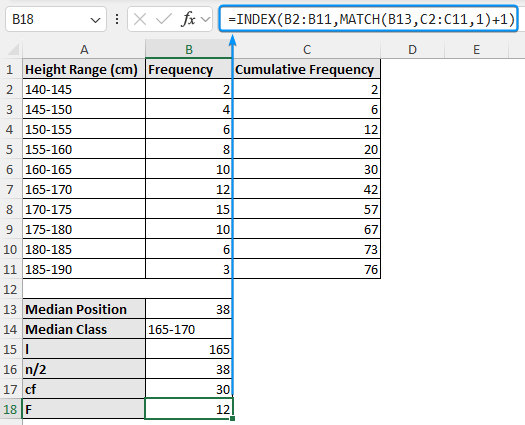
➤ We can use INDEX-MATCH functions to identify the interval/class that contains the median value. The median interval/class is 165-170.
=INDEX(A2:A11,MATCH(B13,C2:C11,1)+1)
➤ Obtain the lower boundary (l) of the median class using the formulas below. For earlier versions of Excel, combine the VALUE, LEFT, and FIND functions. In newer versions, use the TEXTBEFORE function.
=VALUE(LEFT(B14,FIND("-", B14)-1))
Or
=VALUE(TEXTBEFORE(A7,"-"))

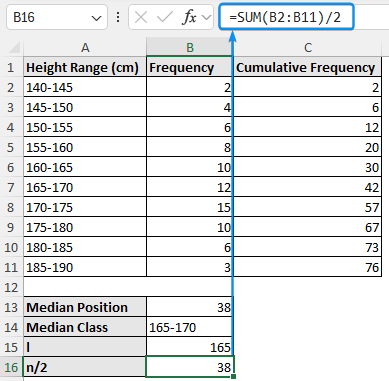
➤ Divide the total frequency by two to calculate the n/2 value.
=SUM(B2:B11)/2
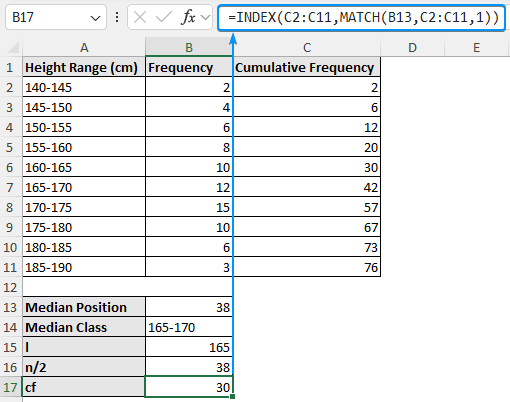
➤ Again use INDEX-MATCH functions to calculate the cumulative frequency of the interval before the median interval (cf).
=INDEX(C2:C11,MATCH(B13,C2:C11,1))
➤ Extract the frequency of the median interval (F)
=INDEX(B2:B11,MATCH(B13,C2:C11,1)+1)
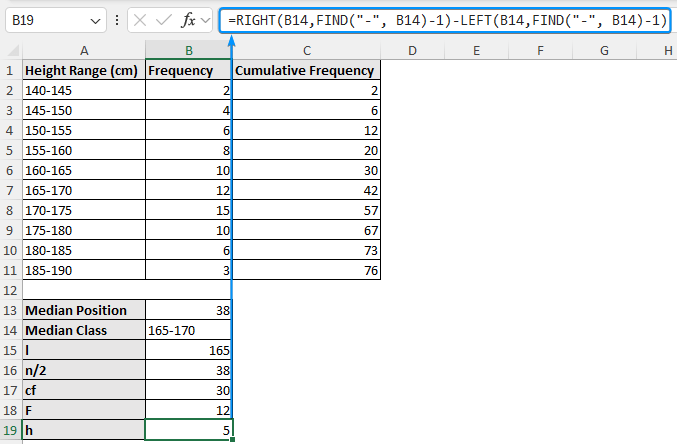
➤ Calculate the class width (h)
=RIGHT(B14,FIND("-", B14)-1)-LEFT(B14,FIND("-", B14)-1)
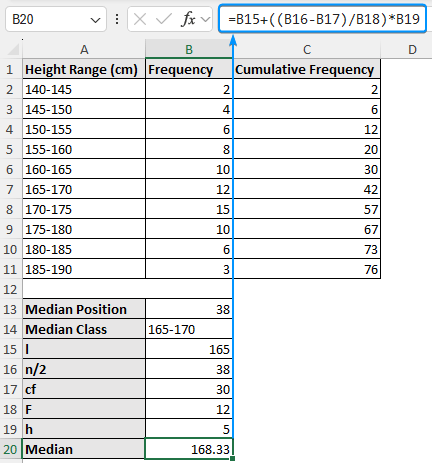
➤ Plug all the values in the formula to calculate the grouped median.
=B15+((B16-B17)/B18)*B19
Optional Formatting
This is an optional step to highlight the class/interval containing the median. This is a dynamic formatting that will be applied automatically, provided the necessary inputs are given.
➤ Select the entire data range (A1:C11) >> In the Home tab, click on Conditional Formatting >> New Rule.

➤ Select the option Use a formula to determine which cells to format.
➤ Enter the formula below. This formula matches the calculated median class from the entire data range and highlights the row where the condition is TRUE.
=$B$14=$A1:$C11
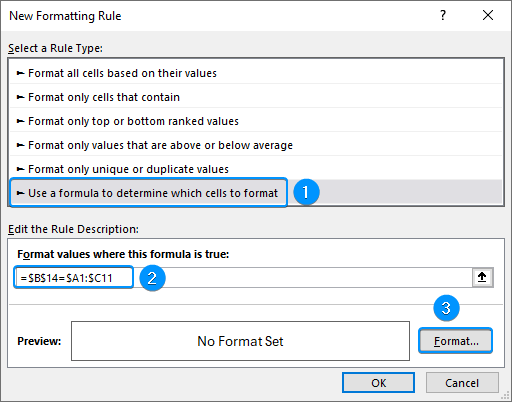
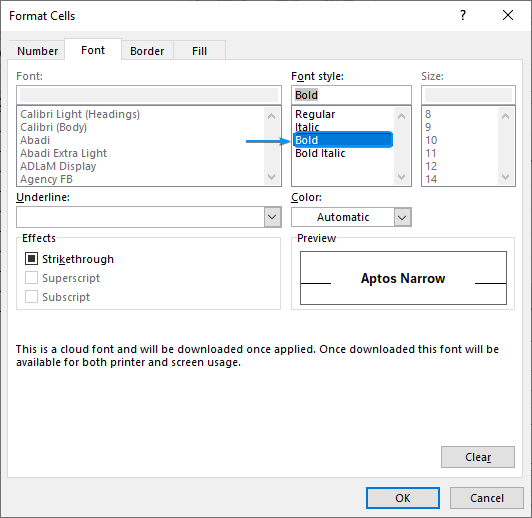
➤ Click the Format button >> Font tab >> Select Bold.
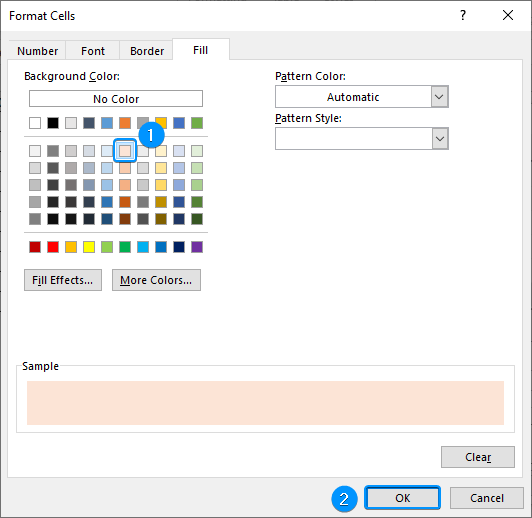
➤ In the Fill tab >> Choose a fill color (Orange, Accent 2, Lighter 80%).
➤ The row containing the median class will be formatted.

➥ The median for this grouped data lies in the 165-170 cm interval.
Frequently Asked Questions
How do you find the median of grouped data?
Median for grouped data: =l+((n/2-cf)/F)*h
where,
➤ l is the lower boundary of the median class.
➤ n is the total number of observations.
➤ cf is the cumulative frequency of the interval before the median interval.
➤ F is the frequency of the median interval
➤ h is the class width.
Why is class width (h) used in the formula?
A uniform distribution is assumed within the class interval because the exact values within each class are unknown.
What is the formula for the median in Excel?
=MEDIAN(cell_reference)
How do you calculate a median if in Excel?
Single criteria: =MEDIAN(IF(criteria,cell_reference))
Multiple criteria: =MEDIAN(IF((criteria1)*(criteria2),cell_reference))
Multiple criteria: =MEDIAN(FILTER(array,(criteria1)*(criteria2)))
For earlier versions of Excel, press Ctrl + Shift + Enter to apply this array formula. For newer versions, just press Enter .
How to find the median of ungrouped data?
➤ Using Excel: =MEDIAN(cell_reference)
Or
➤ Manually: Arrange the data from smallest to largest. If there is an odd number of data points, median is the middle value (n/2). If there is an even number of data points, median is the average of the two middle values =1/2 * (n/2 + (n/2 +1))
Wrapping Up
In this tutorial, we’ve learned about grouped median and how to find median for grouped data in Excel manually and with functions. Feel free to download the practice file and share your thoughts and suggestions.