An aging report is created to summarize the debtors and the outstanding invoices. Businesses often have to sell products on credit. Unfortunately, not every buyer is able to pay their dues on time. An aging report helps businesses understand the condition of outstanding invoices and manage their finances more effectively. In this article, we will learn how to create an aging report in Excel. We will identify the customers who are seriously overdue and prepare charts to visualize the report.
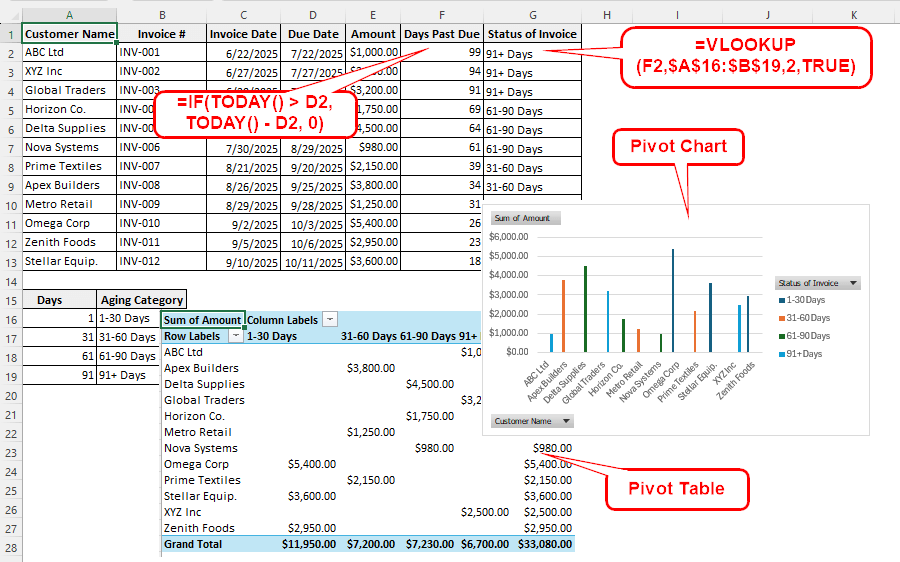
➤ Calculate the days past due using the following formula:
=IF(TODAY() > D2, TODAY() – D2, 0)
➤ Replace D2 with the due date.
➤ Categorize the status of the invoice using the following formula:
=VLOOKUP(F2,$A$16:$B$19,2,TRUE)
➤ Replace F2 with the days past due, and $A$16:$B$19 with the range of category table.
➤ Create a pivot table with the modified new table and add customer name, amount, and status of invoice from the field list.
➤ Create a pivot chart to complete the report.
Below you will find a step-by-step guide on preparing those tables and charts in Excel. Therefore, download the Excel file provided with this article, and follow along.
Steps to Create an Aging Report in Excel
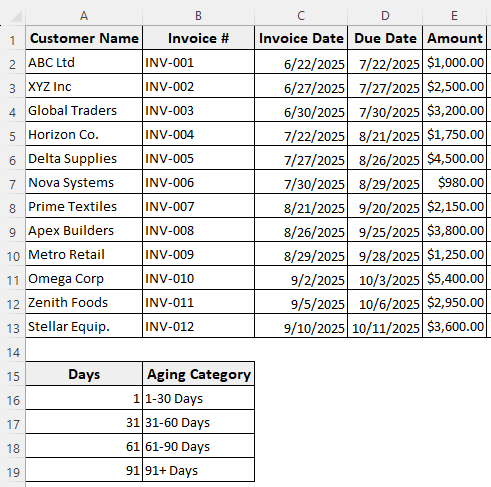
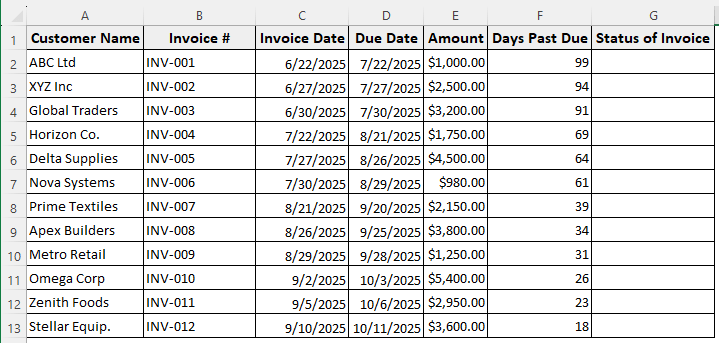
Here we have a table with transactions and another table with categories. In the first table, you will find the customer names, their invoices, the dates they purchased the products, the dates they were supposed to pay the dues, and the amounts they owe us. In the category table, we have the aging categories, along with their starting days and the category to which they belong. We will create an aging report using this data.
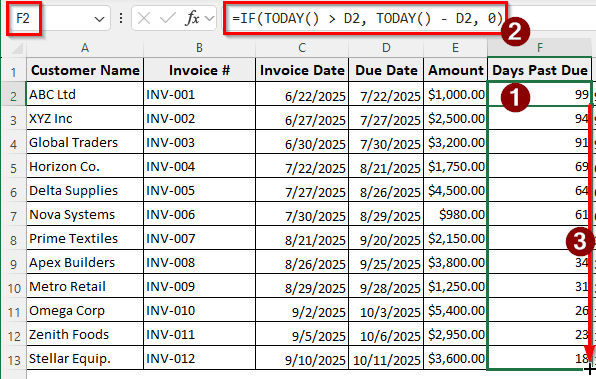
Step 1: Calculate the Days Past Due
First, we need to calculate the number of days the customers have been overdue since their due date. Follow the instructions below:
➤ Add a new column for Days Past Due.
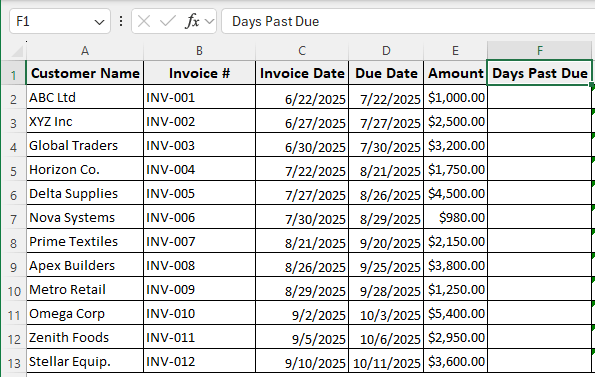
➤ Insert the following formula in the F2 cell and drag it down to fill the column:
=IF(TODAY() > D2, TODAY() - D2, 0)
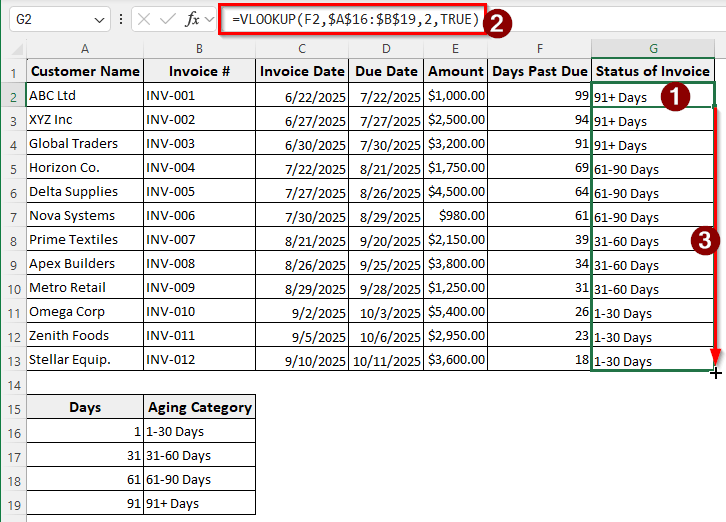
Step 2: Summarize the Status of the Invoices
Now that we have the days past due, we can categorize the status of the invoices using the aging categories.
➤ Add another column for “Status of Invoice”.
➤ Insert the following formula in the G2 cell, and autofill the column:
=VLOOKUP(F2,$A$16:$B$19,2,TRUE)
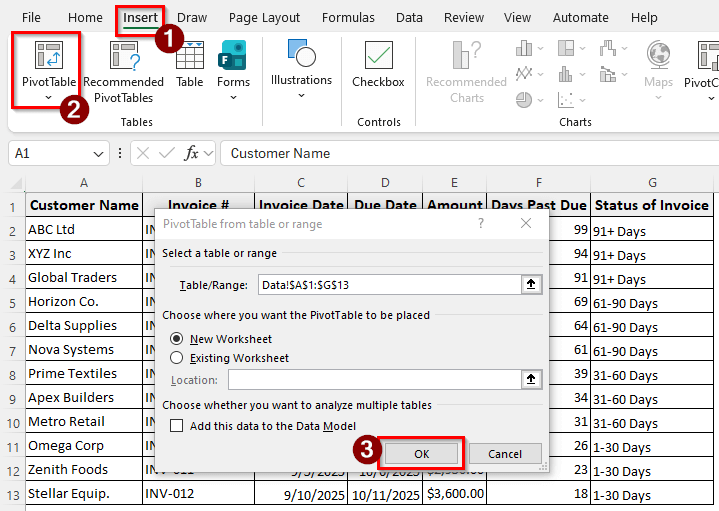
Step 3: Prepare the Report
We have the necessary columns for the report; now it’s time to actually generate the report.
➤ Select the first table with the transactions, and go to Insert > PivotTable.
➤ Press OK to create the pivot table.
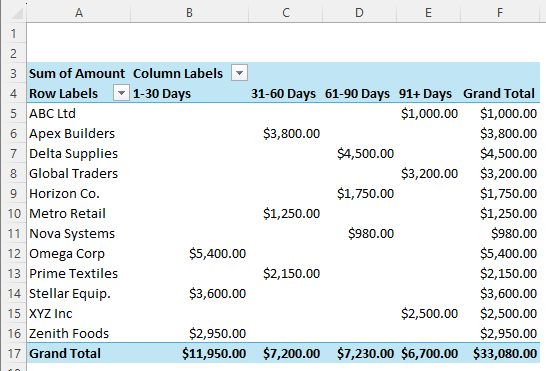
➤ From the PivotTable Fields panel, drag and move the Customer Name to Rows, Status of Invoice to Columns, and Amount to Values.
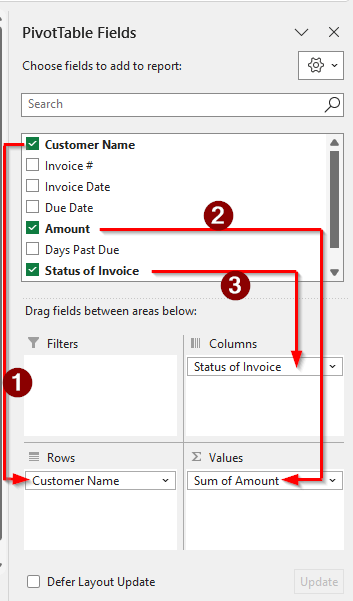
➤ Now the pivot table shows the customer names, how much they owe the business, and what category they fall into. The pivot table report provides all the necessary information for the business to make informed financial decisions based on the data.
Step 4: Create a Chart
The report is done, but no report is complete without a chart. We will learn how to make one in this step:
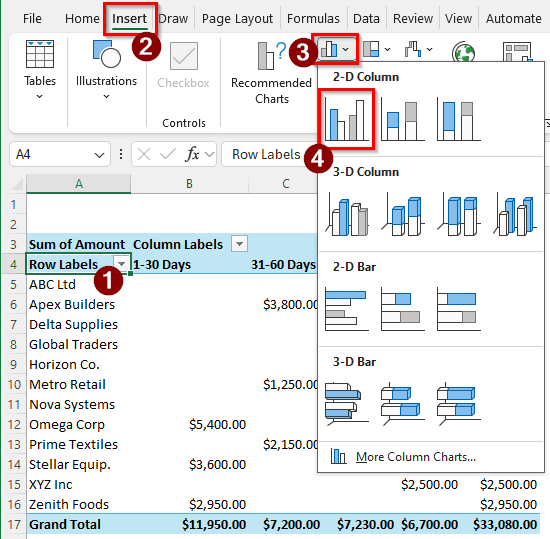
➤ Click on any cell of the pivot table; it is equivalent to selecting the full range of a dataset.
➤ Go to Insert > Charts > 2-D Column and select the first chart.
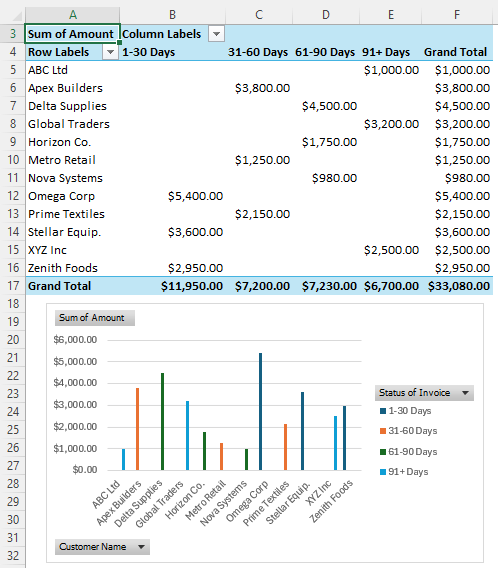
➤ Now the pivot chart is visible with the pivoted report.
Frequently Asked Questions
How do I create an age formula in Excel?
You can use the following formula to calculate the age in Excel:
=DATEDIF(A1,TODAY(),”Y”)
If you insert the birthdate in A1, this formula will show you how old you are as of today.
What is an aging report in Excel?
An aging report sorts the clients of a business based on their outstanding invoices. As outstanding invoices are categorized based on their age, the report is referred to as an aging report. Usually, the invoices are sorted with 30-day intervals.
How do you automatically calculate age in Excel?
Dates are saved as numeric values in Excel. Therefore, you can just subtract the starting date from the ending date to calculate the age. The formula can be like the following:
=A1-B1
Here, A1 contains the ending date and B1 contains the starting date. The result is the age in days. You can format it further if you want.
Can ChatGPT generate Excel files?
Yes. ChatGPT utilizes Python to generate Excel files, allowing you to format and perform calculations as desired. However, you need a subscription if you want to do multiple edits, as the free limit is too low to do any real work.
Is there a standard format for aging reports?
The aging report is prepared by the company for its internal business decisions, not external audits. Therefore, there is no predefined format for aging reports. Companies can prepare their own aging buckets and sort their customers as they see fit.
Wrapping Up
In this article, we have learned how to create an aging report in Excel. We have learned a step-by-step guide to prepare the report and properly sort customers who don’t pay their dues. If you appreciate the guide, take a moment to leave a comment below. If you are experiencing issues with your Excel sheet, please share your concerns below, and we will respond as soon as possible. See you in the next tutorial.