
Excel Charts
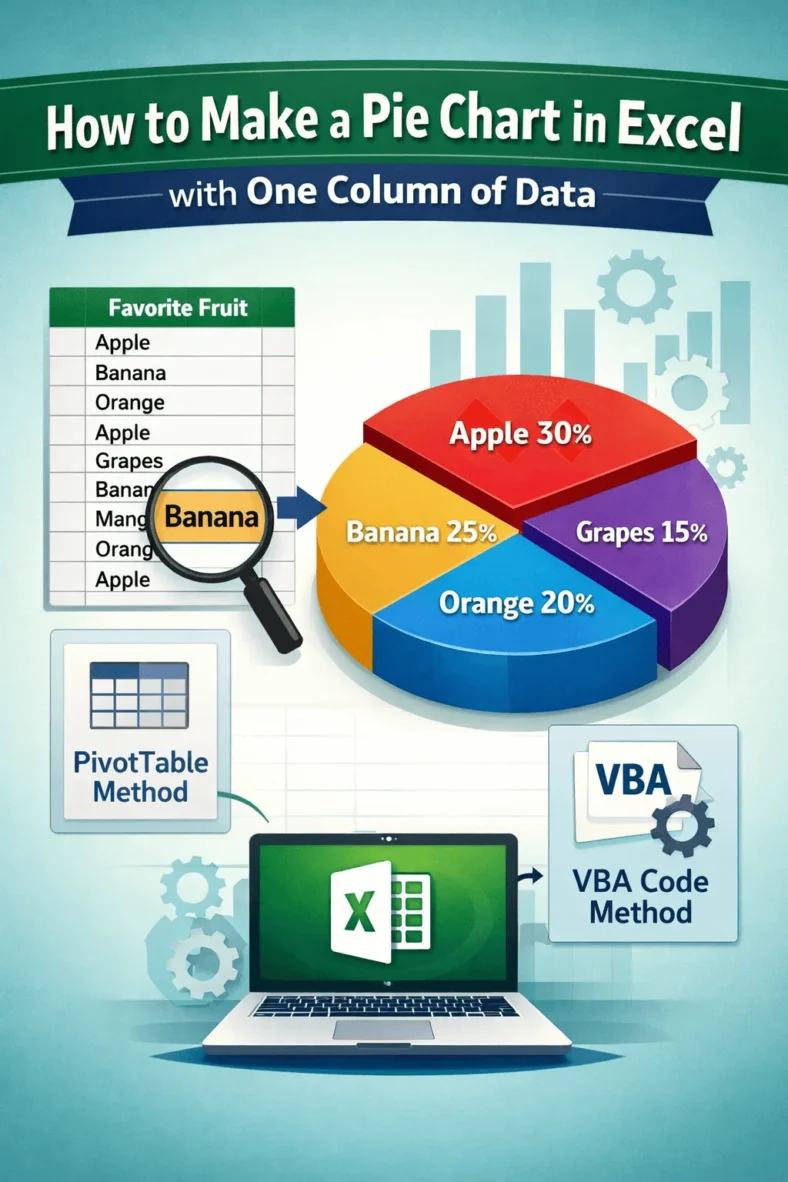
How to Make a Pie Chart in Excel with Multiple Data
In Excel, our dataset typically contains multiple categories, and we need to compare them to extract relevant information. In such a situation, using a pie chart is very useful as

In Excel, our dataset typically contains multiple categories, and we need to compare them to extract relevant information. In such a situation, using a pie chart is very useful as
When we work with datasets of various categories, we often need a quick visualization method to see how differently these values or categories are distributed. For this purpose, using a

When analyzing data or using a formula in Excel, we sometimes need to copy and paste it into another cell. And, in many cases, our formula includes cell references that

In Excel, we often prepare different data-based reports for both business and academic purposes. However, if headers and footers clutter the layout of our report, they can easily distract the

When we prepare professional or academic reports in Excel, we often need to add extra details like page numbers, file names, or dates to make the document more informative. To

When we work with Excel files that contain multiple pages or print areas, sometimes extra blank pages appear when printing or exporting. These extra pages can cause confusion and wasted

When we try to print an Excel sheet or page, it doesn’t always print exactly what we intend. If we click on the Print option, Excel will print the entire

When we work with business or academic data, using a simple average doesn’t always give an accurate result. Because, in most cases, some values carry more importance than others in
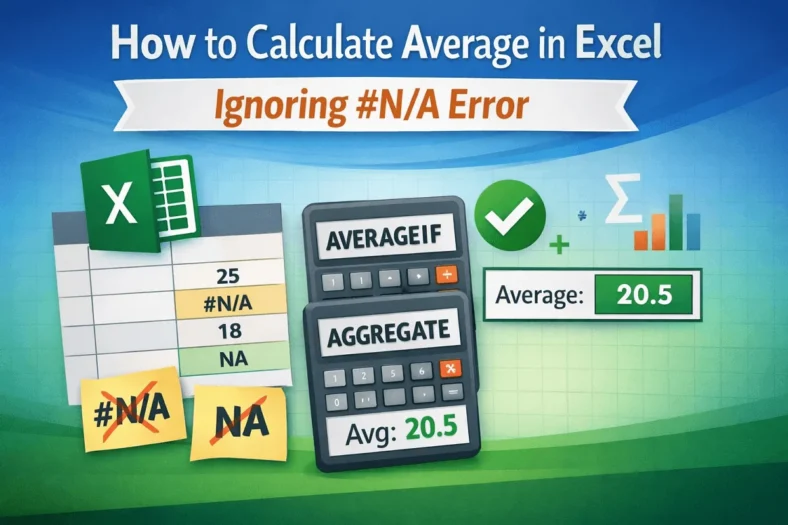
If we try to calculate the average of a range of data in Excel that contains NA or #NA, it will return an error instead of any value. Thus, we