
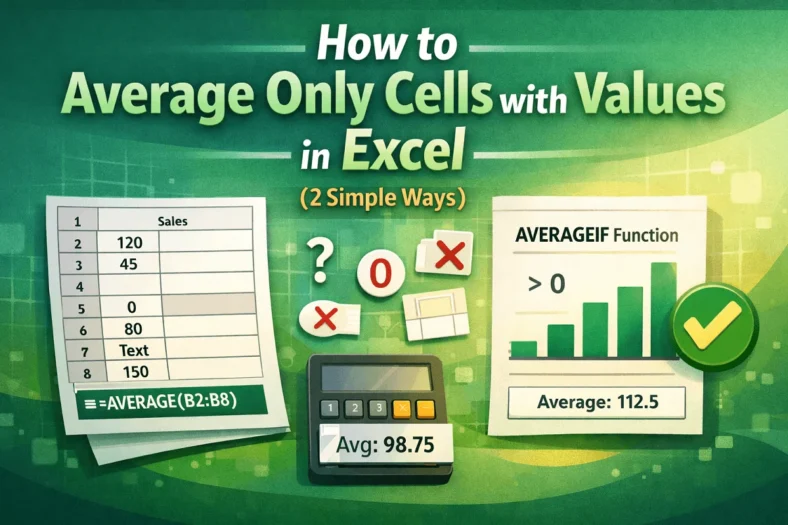
How to Average Only Cells with Values in Excel (2 Simple Ways)
In our Excel dataset, we often encounter blank values or text values. Including the blank value on average can yield misleading results, while including the text data will return an


In our Excel dataset, we often encounter blank values or text values. Including the blank value on average can yield misleading results, while including the text data will return an

When we add, change, or remove any data in Excel, we often need to update formulas, charts, or other related calculations manually, which can lead to mistakes. In such cases,

We use combo charts in Google Sheets to easily compare different types of data on one single chart. This makes spotting patterns and understanding complex information, such as sales and

In Google Sheets data, we often need to calculate the months between two dates to track the payment cycle, project timelines, or determine an employee’s seniority. To calculate this, we

When we need to simplify our data or obtain standardized estimates, we often round up the data to the nearest 10. To do it in Google Sheets, we can use

For formatting or analysis, we often need to convert columns to rows in Google Sheets. For this purpose, we can use the built-in option Paste Special or the TRANSPOSE function.

We need to label legends in Google Sheets to ensure that the viewers of our charts understand the insights clearly. Although charts in Google Sheets usually include a label legend,

To make our data look organized and clear, we sometimes need to merge rows in Google Sheets, especially in the case of grouped data. To do it, we can use

We use the FILTER with OR condition in Google Sheets when we want to include values that meet any one of a preset list of multiple criteria. For example, if
