When working with a large dataset, you may need to identify the last non-blank row in a column, especially when your data includes empty rows between. This is useful for creating dynamic ranges, ...
In any dataset calculating the percentage increase or decrease helps us understand how a value has changed over time, if it's revenue growth, cost savings, or inventory reduction. This is mostly ...
While working with data in Excel, you will frequently need to estimate values between two known points. Interpolation is useful in this situation. This article explores linear interpolation and uses ...
When printing large Excel sheets, your data may spill over to the next page in unpredictable ways. That’s where page breaks come in handy. By inserting manual page breaks between specific rows, you ...
Sharing a workbook in Excel allows multiple users to collaborate on the same file simultaneously. While Excel's older "Share Workbook (Legacy)" feature is still available, Microsoft now recommends ...
When collaborating on spreadsheets, tracking changes is crucial, especially when multiple users are editing a file. Whether you're managing a shared budget, reviewing team reports, or auditing ...
When you're working with large spreadsheets, it's easy to lose track of changes between two Excel sheets. Whether you're reviewing sales records, inventory reports, or updated entries from ...
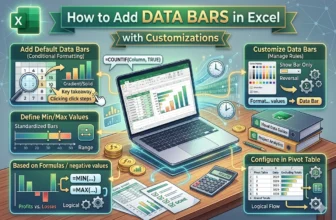
If you're looking to visualize data trends quickly in Excel, data bars are a simple yet effective feature. They turn plain numbers into colored bars directly within cells, making it easier to compare ...
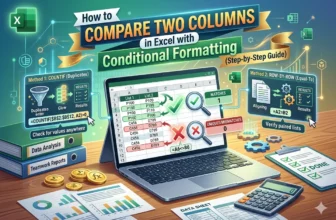
When working with large datasets in Excel, manually checking for differences or matches between two columns can be tedious. Luckily, Excel offers visual tools like Conditional Formatting that make it ...