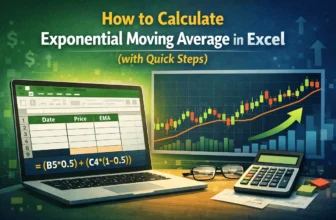
In the financial market, the exponential moving average is a commonly used calculation to detect buying and selling opportunities. These days, recent prices usually affect the market more than ...
While latitudes and longitudes are usually expressed in degrees, minutes, and seconds, not all programs can use this format. In GIS software, you need to input the data in decimal degrees, or it ...
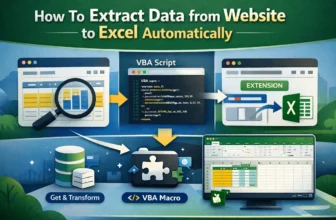
In this era of big data, people often need to work with data scraped from websites. But copying and pasting data from websites is not an efficient method to do it. Fortunately, it is possible to ...
In a spreadsheet, there could be a lot of columns and rows. The data gets cluttered and sometimes, we find that we do not need a few columns or cells. Those multiple cell data could be written in one ...
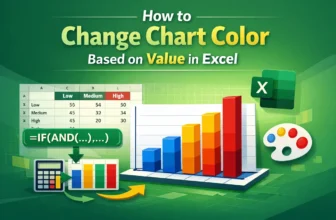
Coloring a chart by value assigns a unique color to each data point according to its value. To change the chart color based on value in Excel, we need to split the source data into different series ...
In data analysis, we often need to find values of significant data points in a dataset. For example, in a business, you might have some product names and want to look up the stock level of that ...
Sending a large number of emails can be a tough job. Fortunately, apps from Microsoft 365 make the process easier. From a list of emails from excel, you can send tons of personalized emails to your ...
While most people use the 12-hour clock for their activities, there are scenarios where using military time is more relevant. However, not everyone is able to read military time. In a project, it ...
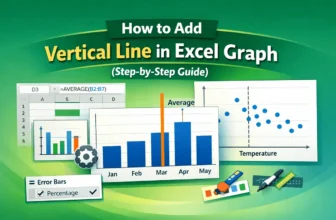
A vertical or horizontal line is the benchmark or reference to highlight a specific point. To add a vertical line in an Excel graph, we need to either modify a combo chart or a vertical error bar.
...