How to Add Trendline in Google Sheets
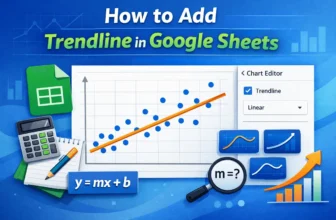
Trendlines are often used to understand the pattern of a dataset. If you want to track and analyze your data better, you might have to create a trendline after making a chart. In this article, you ...
Trendlines are often used to understand the pattern of a dataset. If you want to track and analyze your data better, you might have to create a trendline after making a chart. In this article, you ...

A trendline is a line that represents the general direction of the data. To extend a trendline in Excel, we need to increase the forward, backward, or both values of the forecast.It simplifies ...
While recording data, it is not unusual to insert duplicate information by mistake. Sometimes, due to slow servers or due to recording errors, your excel sheet can end up with multiple transactions ...

The unknown value in a graph refers to the non-existent values in the source. Finding an unknown value in an Excel graph requires the equation of the trendline.The goal of every form of data ...
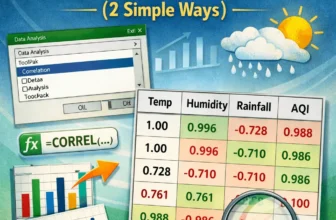
A correlation matrix is the ideal tool for examining data containing multiple variables and determining their relationships. This tutorial explores how to make correlation matrix in Excel with built ...
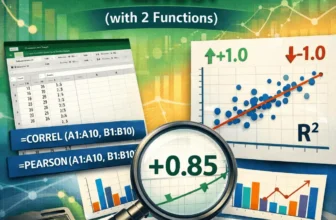
The key to data analysis is understanding how variables are related. In this tutorial, you will learn how to find the correlation coefficient in Excel and interpret the findings. By calculating the ...

An equation in an Excel graph provides information about the scattered data in the graph. To show the equation in an Excel graph, you need a suitable chart for a trendline and enable the option to ...
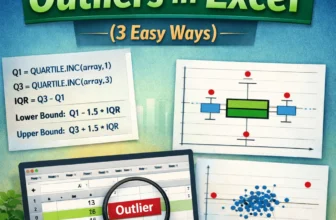
Outliers can distort your data and lead to inaccurate results. This article will teach you how to calculate outliers in Excel and help you deal with outliers. Whether you're analysing website ...
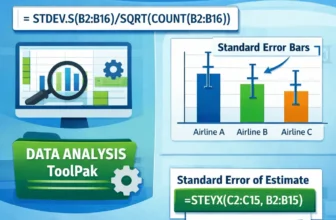
Understanding how data differs is important whether you're comparing airline performance, assessing marketing strategies, or summarizing survey findings. Standard error is one such statistic that ...