A Pivot Table is a useful tool in Excel for organizing large datasets. By default, when you add multiple fields to the Rows area, Excel displays them in a Compact Form, which nests them in a single ...
In an Excel PivotTable, by default, the Values area only displays numerical data. Sometimes you might need to show text instead of values. By adding new measures or using format cells, you can ...
Ever feel the necessity to use SUMPRODUCT combined with conditionals? Exactly the way we use SUMIF. Though SUMPRODUCT has built-in unique functionality to use conditionals, Excel does not have any ...
A timeline in a pivot table to filter the table using time-based data. When analyzing data for a specific time period, a timeline makes it easier to filter the table than using a slicer. Instead of ...
Filtering a pivot table by a date range helps find the exact data you need for an analysis. Imagine you need to find the sales data for 10 days of a specific month. Filtering will help you extract ...
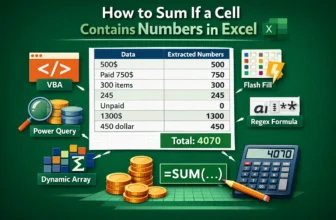
A single column can contain numbers, text, and text with numbers in an Excel worksheet. Such as 500$, 450 dollar, 750$ (paid yesterday), or even words like unpaid. Excel understands them as text, and ...
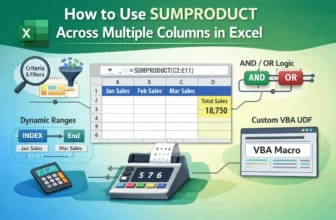
Most Excel users are comfortable adding up the numbers across a single column. Drag cells or do a quick SUM and you're done. But things get trickier when your data extends to several columns, like ...
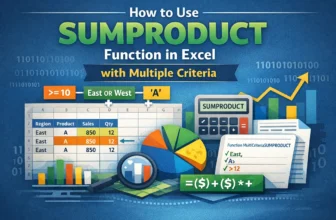
When it comes to sum a range of data while handling multiple conditions in Excel, we often start to fumble. Most of the time, we jump to the SUMIFS formula without thinking twice. But what if you ...
In Excel, you often require the sum of ranges of cells based on some criteria. Usually, you can do this with SUMIFS for a single sum range. However, to do the same thing for multiple columns, you ...