When analyzing data in Excel, calculating percentages can give you a better understanding of proportions, trends, or distributions. With the COUNTIF function, you can quickly find out how much of your data meets a certain condition, and then divide that by the total count to get the percentage.
In this article, we’ll walk through the most effective ways to use COUNTIF to calculate percentages using different types of conditions, such as text, numbers, and thresholds. Each method is demonstrated with a relevant dataset and a working formula.
Steps to use COUNTIF to calculate percentage in Excel:
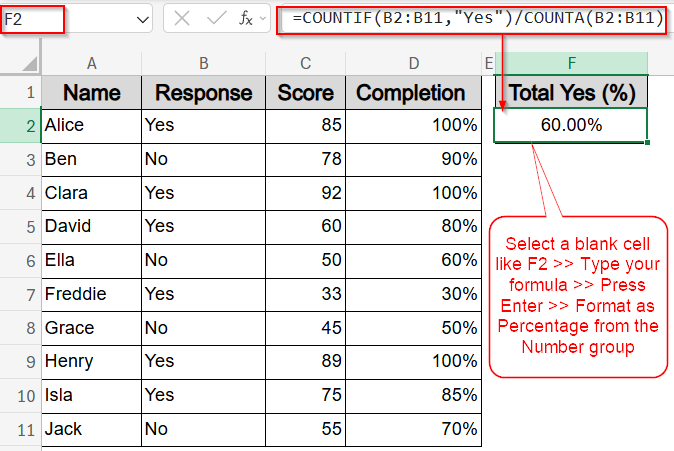
➤ Click on a blank cell where you want to display the percentage, such as F2.
➤ Type the following formula:
=COUNTIF(B2:B11,”Yes”)/COUNTA(B2:B11)
This formula counts all the “Yes” responses in column B and divides it by the total number of filled cells in that same column. The result gives you the proportion of “Yes” answers relative to total responses.
➤ Press Enter to confirm the formula.
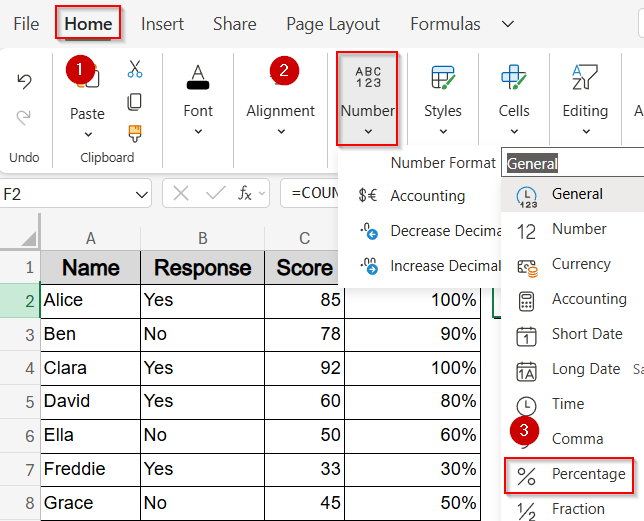
➤ Go to the Home tab and click Percentage Style ( % ) under the Number drop-down to convert the result into a readable percentage format.
Calculate Percentage of Specific Text Responses
If you have a list of survey or form responses, it’s often useful to see what percentage of respondents gave a specific answer such as “Yes“. This method is perfect for calculating how frequently a particular text value appears in a column compared to the total number of responses. It helps summarize feedback or participation trends at a glance.
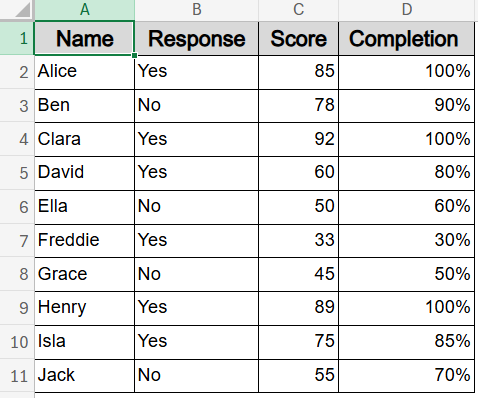
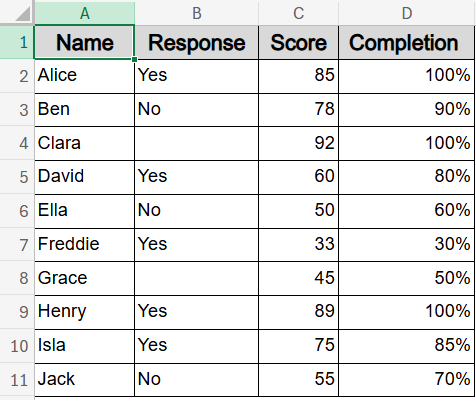
We’re working with a dataset of 10 participants who filled out a feedback form. The table captures their names, whether they responded, their test scores, and their task completion percentages.
Steps:
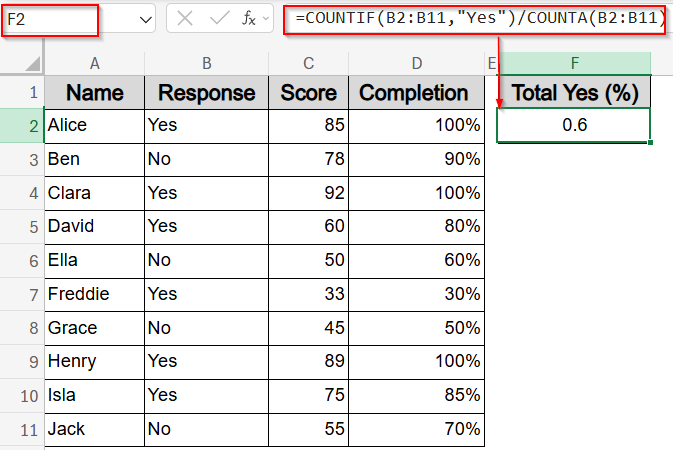
➤ Click on a blank cell where you want to display the percentage, such as F2.
➤ Type the following formula:
=COUNTIF(B2:B11,”Yes”)/COUNTA(B2:B11)
This formula counts all the “Yes” responses in column B and divides it by the total number of filled cells in that same column. The result gives you the proportion of “Yes” answers relative to total responses.
➤ Press Enter to confirm the formula.
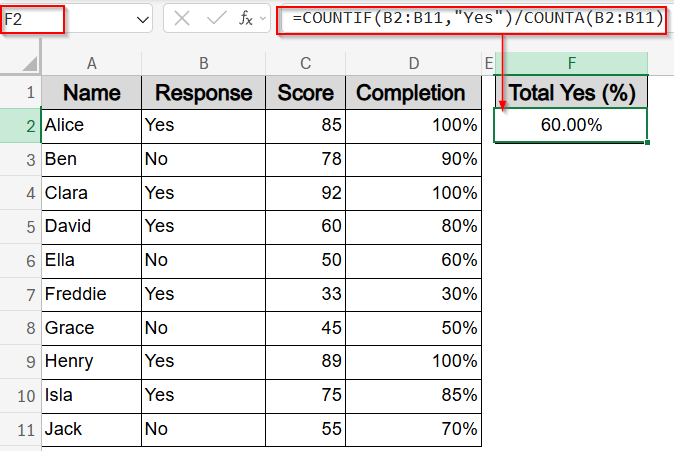
➤ Go to the Home tab and click Percentage Style ( % ) under the Number drop-down to convert the result into a readable percentage format.

This will return the percentage of “Yes” responses in the dataset.
Set Up a Numeric Threshold to Calculate the Value of Percentage
This method is useful when you want to find out how many values in a column exceed a certain limit, for example, what percentage of people scored 80 or higher on a test or evaluation. It’s especially helpful for identifying high performers or tracking overall performance trends.
Steps:
➤ Click on a blank cell where you want the percentage to appear, such as F2.
➤ Enter the following formula:
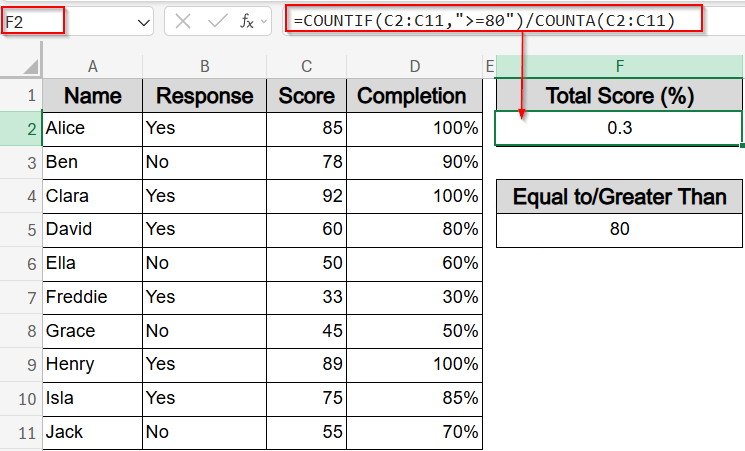
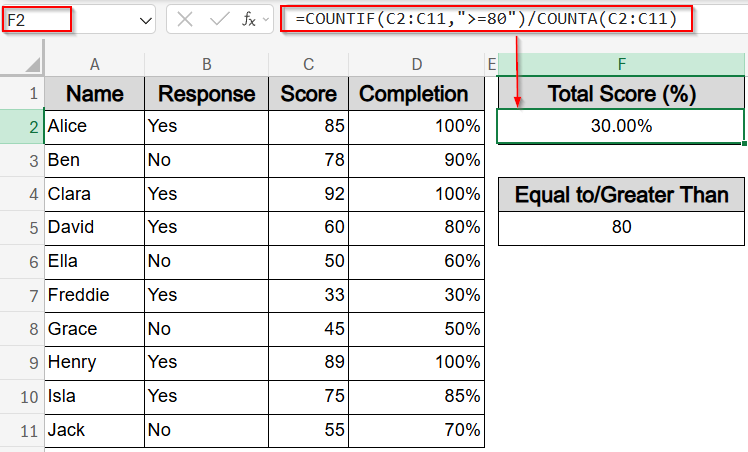
=COUNTIF(C2:C11,”>=80″)/COUNTA(C2:C11)
This formula counts how many values in column C are 80 or higher, then divides that by the total number of non-blank entries in the same column to return the percentage of values meeting the threshold.
➤ Press Enter to apply the formula.
➤ Go to the Home tab and click Percentage Style ( % ) under the Number drop-down to convert the result into a readable percentage format.
The result shows what percentage of people scored 80 or more.
Find Percentage of Entries That Reached Full Completion
Sometimes you need to identify how many participants or records achieved full completion like tasks finished at 100%. This method uses the COUNTIF function to calculate the percentage of values in a column that exactly match a specific percentage.
Steps:
➤ Click on a blank cell where you want the result to appear, such as F2.
➤ Type in the following formula:
=COUNTIF(D2:D11,”=100%”)/COUNTA(D2:D11)
This formula checks how many values in the Completion column are exactly 100%, then divides that by the total number of entries to give you the percentage of fully completed responses.
➤ Press Enter to calculate the result.
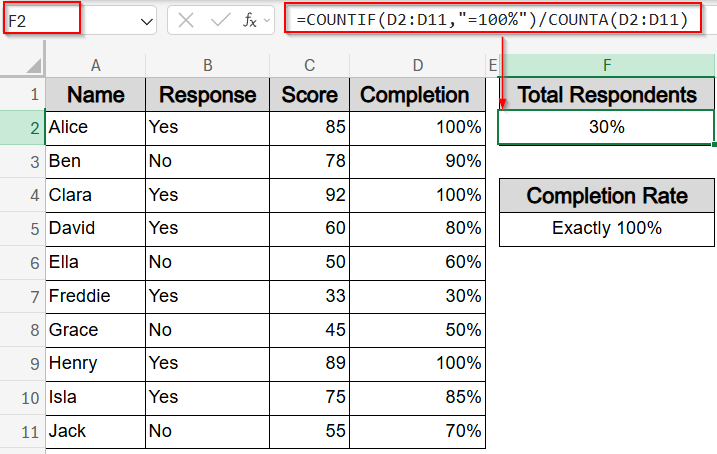
Now this displays the percentage of respondents who had perfect completion.
Measure Percentage of Responses That Are Not Blank
In data analysis, it’s important to know how complete your dataset is, especially when collecting survey responses or feedback. This method calculates the percentage of non-blank entries in a specific column, helping you quickly identify how much of your data has been filled in. Let’s get started with our modified dataset.
Steps:
➤ Click on a blank cell where you’d like the result to appear, such as F2.
➤ Enter this formula into the cell:
=COUNTIF(B2:B11,”<>”)/ROWS(B2:B11)
Here, you can change B2:B11 according to your required range in your dataset.
➤ Press Enter to get the result.
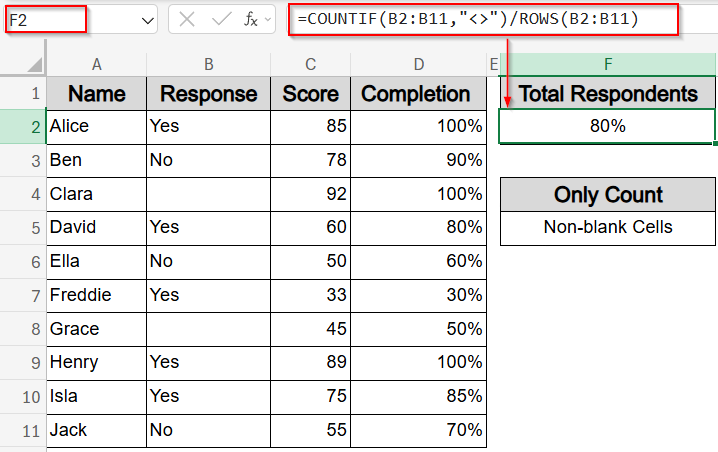
This gives you the percentage of filled responses in the column, which is useful for evaluating data quality or completeness.
Frequently Asked Questions
How does COUNTIF help calculate percentages in Excel?
The COUNTIF function lets you count how many cells meet a specific condition. When you divide that number by the total entries using the COUNTA function, you get a percentage that reflects how common that condition is within the dataset.
Can I use COUNTIF for text and numbers in the same formula?
Yes, COUNTIF function is flexible enough to handle both text and numeric criteria. You can count values like “Yes” responses or scores above a certain number using the same basic structure with slight changes to the condition.
Do I need to format the result manually as a percentage?
Yes, Excel returns the result as a decimal by default. You need to format the cell using Percentage Style from the Home tab to properly display the value as a percentage for better readability and presentation.
Will COUNTIF ignore blank cells when calculating percentages?
COUNTIF function only counts cells that meet the condition, and COUNTA function excludes completely empty rows. So if your range has blank cells, they’re not counted in either part, which keeps the percentage accurate.
Wrapping Up
In this tutorial, we explored how to use the COUNTIF function to calculate percentages in Excel based on various conditions such as text values, numeric thresholds, exact matches, and data completeness. Each method demonstrates how dividing a conditional count by the total count gives you a fast and reliable percentage that reflects the performance of our dataset. Feel free to download the practice file and share your feedback.