Pivot Tables are used in Excel for summarizing and exploring data. By default, when you place more than one field in the Rows area, Excel groups them in a nested structure, which can make the report harder to read. This layout is called the Compact Form. The good news is that Excel offers different report layouts that let you display each row field in its own column. In this article, we will walk you through several methods to show multiple columns without nesting in Pivot Table.
To show multiple columns without nesting in a Pivot Table, here is one simple solution by changing the Report Layout.
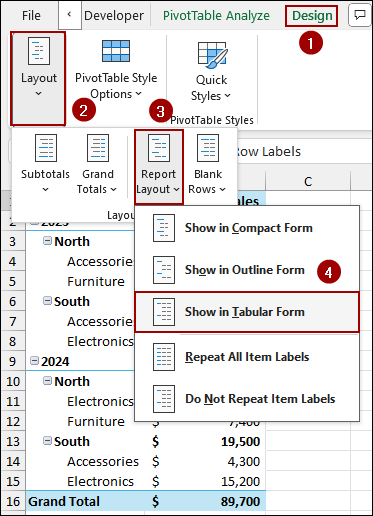
➤ Select your Pivot Table and go to Design.
➤ In the Layout group, click Report Layout.
➤ Choose Show in Tabular Form to show multiple rows without nesting.
Changing Report Layout to Tabular Form
In order to present your data in a professional way, Tabular Form can be your best choice. This layout separates your nested columns into individual columns, creating a classic table layout that is easy to read.
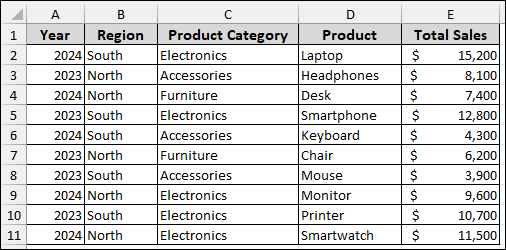
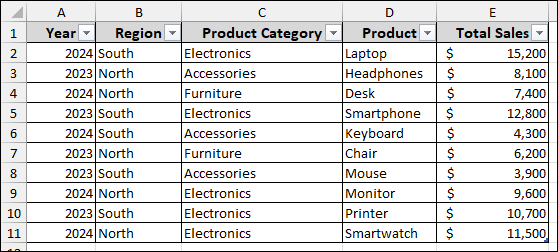
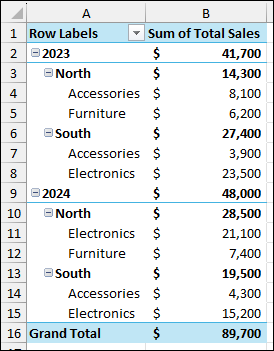
Suppose we have a sample dataset containing Year, Region, Product Category, Product, and Total Sales. First, we will create a Pivot Table, then we will change the report layout to Tabular Form to display the columns without nesting.
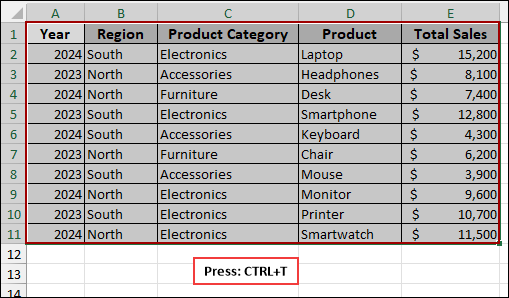
➤ Select the dataset and press Ctrl + T to convert data into a table.
➤ Next, checkmark the My table has headers and click OK.
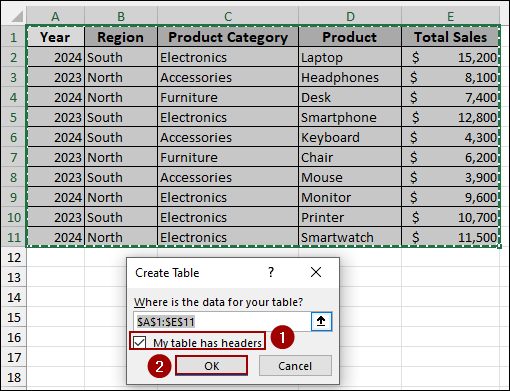
As a result, the dataset will convert into a table.
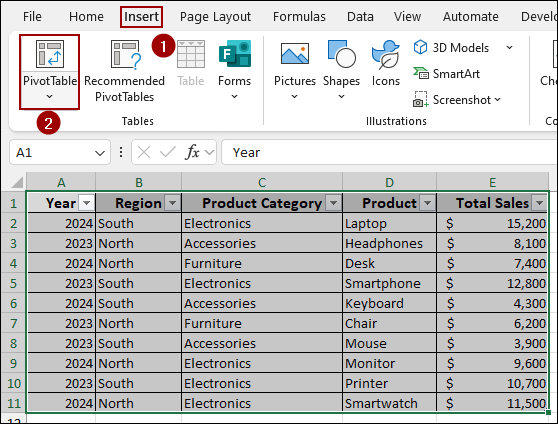
➤ Select the dataset and click Insert > PivotTable.
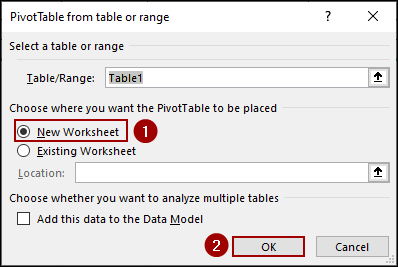
➤ From the new window, choose New Worksheet and click OK.
➤ From the PivotTable Fields pane, drag the fields to the Rows and Values section according to the image.
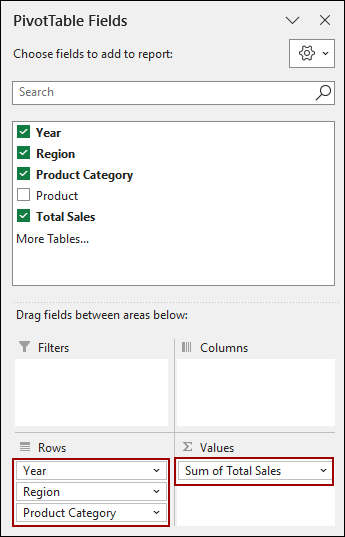
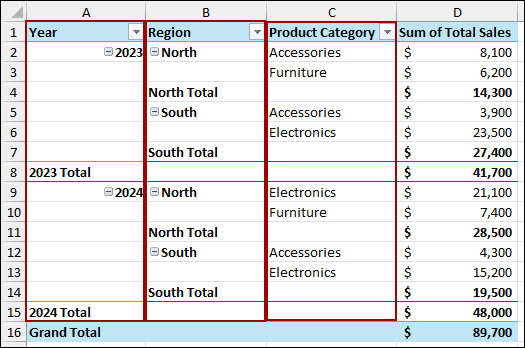
Now, we have our Pivot Table in our hands. Here, you will notice how the Product Category and Region are nested under Year, making the table look cluttered.
To separate these fields,
➤ Click anywhere inside your Pivot Table.
➤ Go to the Design tab on the ribbon.
➤ In the Layout group, click Report Layout.
➤ From the dropdown menu, select Show in Tabular Form.
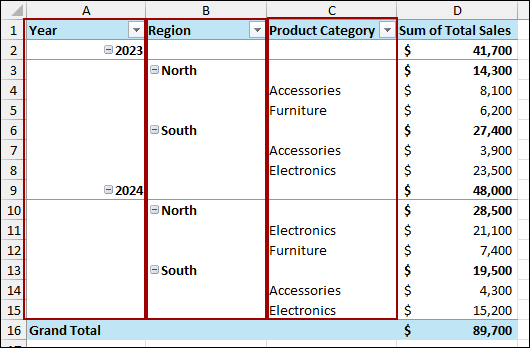
Finally, your Pivot Table will now display the fields in a clean, tabular format, separating multiple columns into their own column.

Switching Report Layout in Outline Form
You can also use the Outline Form from the Report Layout feature. This method is an alternative to the Tabular Form. The Outline Form presents a slightly different structure, unnesting data with many subcategories.
To change your Pivot Table to Outline Form,
➤ Select your Pivot Table.
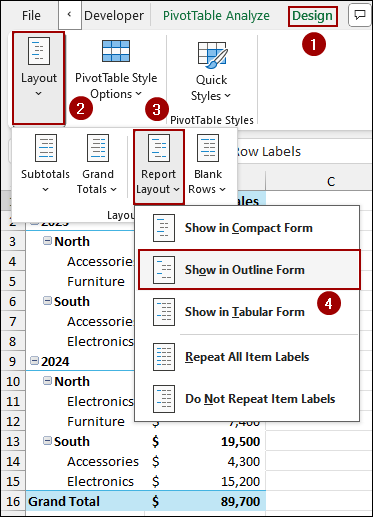
➤ Navigate to the Design tab and choose Layout.
➤ Go to the Report Layout dropdown.
➤ This time, select Show in Outline Form.
As a result, we have successfully changed the layout to show multiple columns without nesting in the Pivot Table. The result will look much like the Tabular Form, but the subtotals will appear at the top of each group instead of the bottom.
The main difference between Tabular and Outline forms is in the placement of the subtotal. Tabular places them at the bottom, while Outline places them at the top. The choice depends on your preference for data presentation.
Using Classic Pivot Table Layout Feature
The Classic Pivot Table Layout is perfect for unnesting columns. With this feature, you can also drag fields directly within the Pivot Table grid.
To activate the Classic Pivot Table Layout,
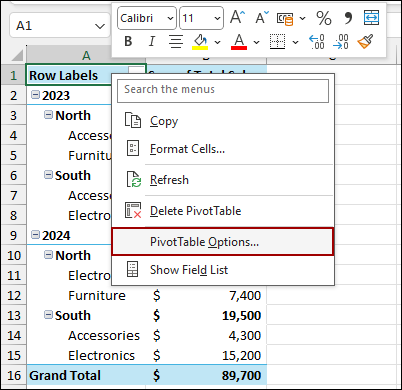
➤ Right-click anywhere on your Pivot Table.
➤ From the context menu, select PivotTable Options.
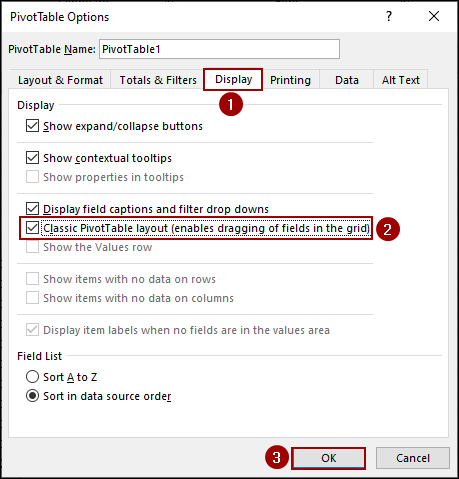
➤ In the PivotTable Options dialog box, go to the Display tab.
➤ Checkmark the box for Classic PivotTable layout (enables dragging of fields in the grid).
➤ Click OK.
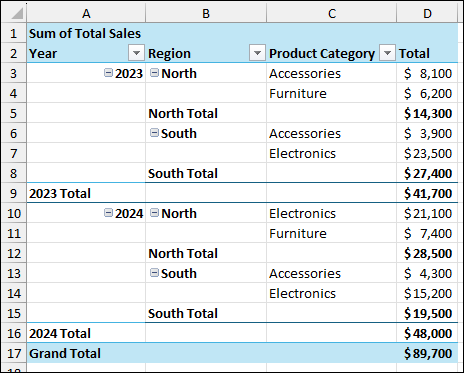
Finally, your Pivot Table will now be in a classic format, unnesting multiple columns in its own column. One key advantage of this layout is that you can drag fields directly within the Pivot Table grid to rearrange them, which is not possible in the other layouts.
Frequently Asked Questions
Can I use multiple of these methods at the same time?
No, you can only have one report layout (Compact, Outline, or Tabular) and one overall layout (Classic or default) at a time. Changing one will override the previous setting.
My Pivot Table still looks nested after changing the layout. What’s wrong?
Ensure that you have more than one field in the rows area of the Pivot Table Fields pane. If you only have one field, there is nothing to un-nest. Also, double-check that you have chosen Tabular or Outline from the Report Layout menu.
Can I keep the layout permanent for all new Pivot Tables?
Yes, you can change the default Pivot Table layout in Excel Options (under Data > Edit Default Layout) so new Pivot Tables open directly in Tabular or Outline Form instead of Compact Form.
Concluding Words
Above, we have explored several methods to show multiple columns without nesting in a Pivot Table. By using the Report Layout options or the Classic PivotTable layout feature, you can easily unnest columns. The most recommended approach is to use Show in Tabular Form, as it provides a professional-looking report. If you need assistance with similar Pivot Table adjustments, feel free to share them below.