A Pivot Table is a great feature for analyzing and summarizing complex data. However, when you add multiple fields to the Rows area, Excel automatically nests them, creating a complex structure that can be difficult to read. This is the default Compact Form. Fortunately, there are several methods to display these fields side by side in separate columns. In this article, we will show you how to display multiple row fields without nesting by using different report layouts.
To show multiple rows without nesting in a Pivot Table, here is one simple solution by changing the Report Layout.
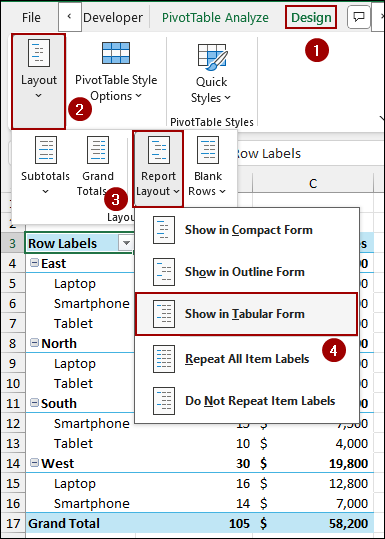
➤ Select your Pivot Table and go to Design.
➤ In the Layout group, click Report Layout.
➤ Choose Show in Tabular Form to show multiple rows without nesting.

Changing Report Layout to Tabular Form
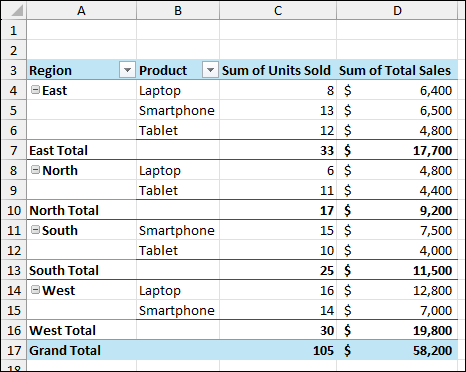
This is the most common method for separating your nested row fields into individual columns. The Tabular Form presents your data in a classic table layout, making it easier to read and adjust.
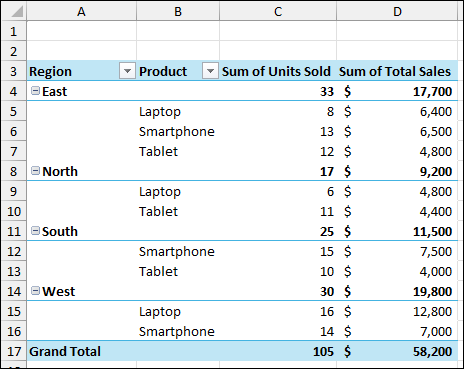
Suppose we have region-wise sample sales data for some products. Now, we will create a Pivot Table and then use Tabular Form layout to show rows without nesting.
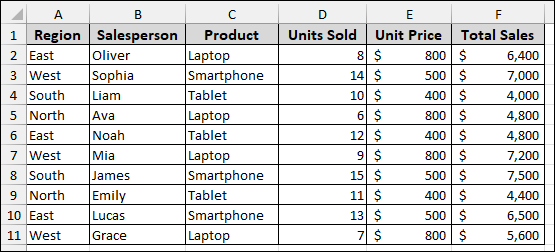
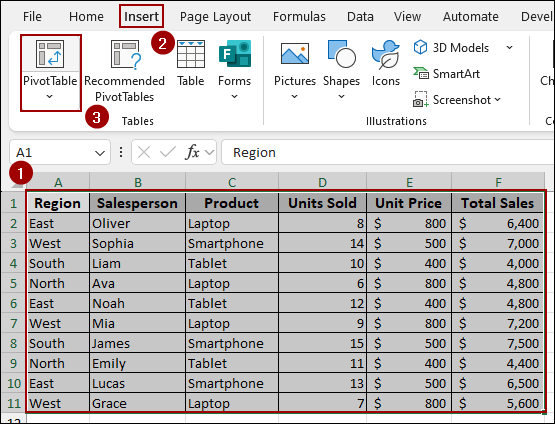
➤ Select the dataset and click Insert > PivotTable.
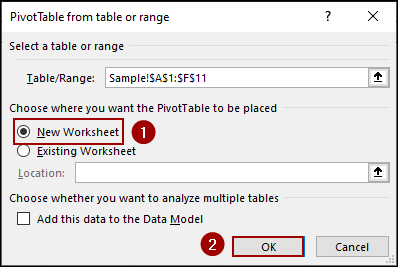
➤ From the new window, choose New Worksheet and click OK.
Thus, our Pivot Table will be created. As you can see, the Product field is nested under the Region field.
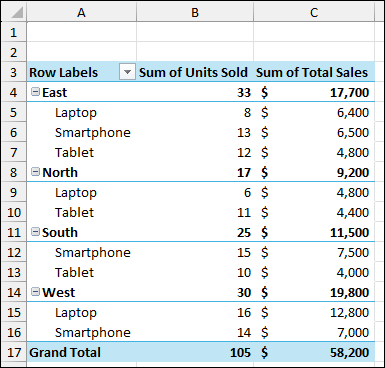
To separate the product field.
➤ Click anywhere inside your Pivot Table.
➤ Go to the Design tab on the ribbon.
➤ In the Layout group, click Report Layout.
➤ From the dropdown menu, select Show in Tabular Form.
Your Pivot Table will now display the fields in a clear, tabular format, with each row field in a column.
Showing Layout in Outline Form
The Outline Form is very similar to the Tabular Form but presents a slightly different structure. It’s another excellent option for un-nesting your row fields.
To change your Pivot Table to Outline Form.
➤ Select your Pivot Table.
➤ Navigate to the Design tab and choose Layout.
➤ Go to the Report Layout dropdown.
➤ This time, select Show in Outline Form.
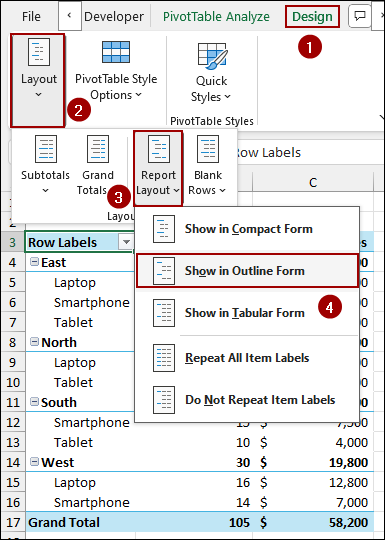
The result will look much like the Tabular Form, but the subtotals will be at the top of each group.
The main difference between Tabular and Outline forms is in the placement of the subtotal. Tabular places them at the bottom, while Outline places them at the top. The choice depends on your preference for data presentation.
Applying Classic Pivot Table Layout Feature
This method is an older, but still useful, approach to getting a non-nested layout. It’s often preferred by users who are used to the layout from older Excel versions.
To activate the Classic Pivot Table Layout.
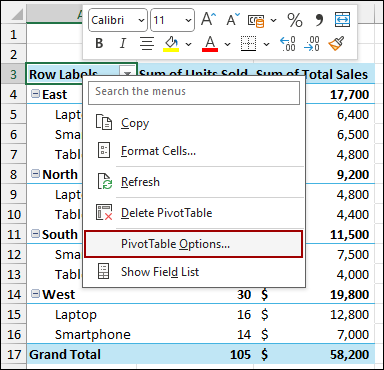
➤ Right-click anywhere on your Pivot Table.
➤ From the context menu, select PivotTable Options.
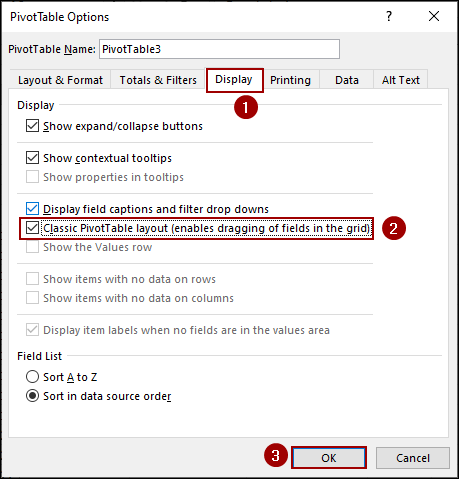
➤ In the PivotTable Options dialog box, go to the Display tab.
➤ Checkmark the box for Classic PivotTable layout (enables dragging of fields in the grid).
➤ Click OK.
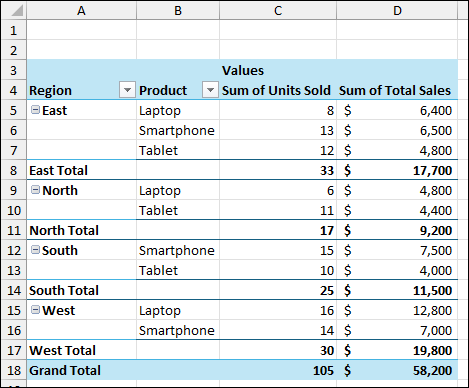
Your Pivot Table will now be in a classic format, with each row field in its column. One key advantage of this layout is that you can drag fields directly within the Pivot Table grid to rearrange them, which is not possible in the other layouts.
Frequently Asked Questions
Why does Excel nest my fields by default?
Excel’s default format in Pivot Table is the Compact Form because it saves space and is often a good way to present summary data, especially with many row fields.
Can I use multiple of these methods at the same time?
No, you can only have one report layout (Compact, Outline, or Tabular) and one overall layout (Classic or default) at a time. Changing one will override the previous setting.
My Pivot Table still looks nested after changing the layout. What’s wrong?
Ensure that you have more than one field in the rows area of the Pivot Table Fields pane. If you only have one field, there is nothing to un-nest. Also, double-check that you have chosen Tabular or Outline from the Report Layout menu.
Concluding Words
Above, we have explored several methods to show multiple rows without nesting in a Pivot Table. By using the Report Layout options or the Classic PivotTable layout feature, you can easily change how your row fields are displayed. The most recommended approach is to use Show in Tabular Form, as it provides a clean, professional-looking report. If you have any further questions or need assistance with similar Pivot Table adjustments, feel free to share them below.