
Filtering dates by month and year in Excel means narrowing down your dataset to only the rows that match specific time criteria. For example, viewing only July 2023 sales records or attendance data for a certain year. In Excel, filtering dates by month and year helps users focus on time-based insights without manually sorting through rows. Excel can handle this through formulas and built-in filter tools.
To filter dates by month and year in Excel, follow these steps:
➤ Select the range that contains your date column and related data.
➤ Use the FILTER function or AutoFilter to specify criteria for month and year.
➤ Enter the month and year values in separate cells (e.g., F1 for month and F2 for year) to dynamically view records matching your input.
In this article, we will describe how to filter dates by month and year in Excel using the Filter Command, Filter Function, PivotTable, and VBA macro button method.
Apply the Filter Tool to Filter Dates by Month and Year in Excel
Excel’s Sort & Filter feature is used here to filter specific date ranges, such as particular months or years. This is necessary for analyzing large datasets that contain date-based records like sales, attendance, or transactions. We use this method to easily display only the data from the month(s) or year(s) of a dataset.
We have a dataset that contains the monthly sales of employees for three years. We will view only sales data for April 2023 and May, and July 2024 to analyze the performance. We will use Excel’s Filter Command to quickly extract and view those months.
Steps:
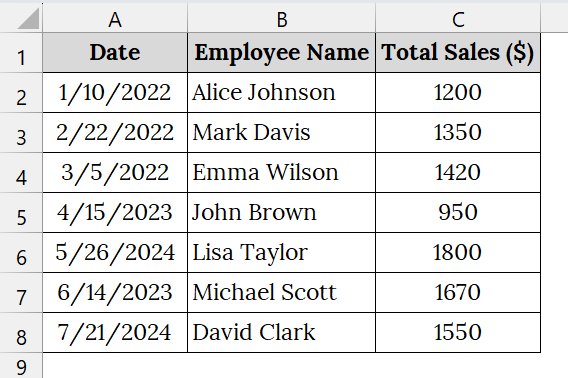
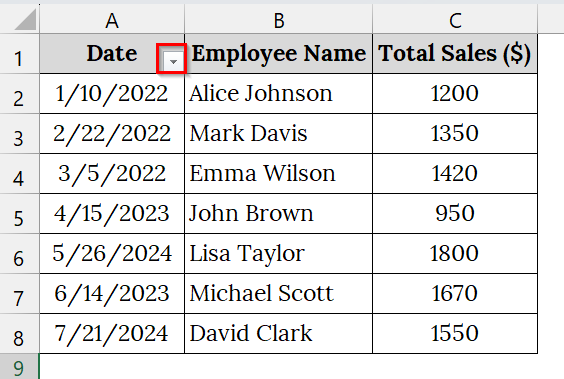
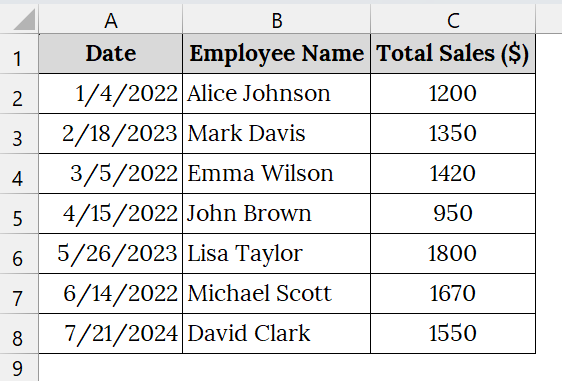
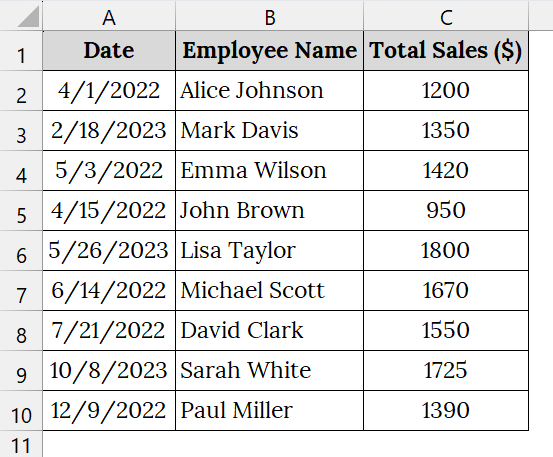
➤ Open your Excel Workbook. For example, we have taken a dataset that contains Date in Column A, Employee Name in Column B, and Total Sales ($) in Column C.
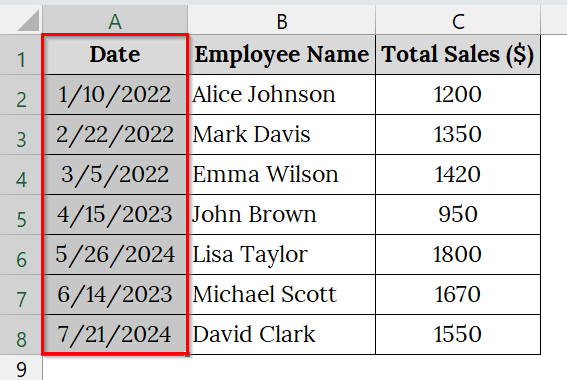
➤ Select the Column that contains your dates. For example, select cell A1 to A8.
➤ Go to the Home tab.
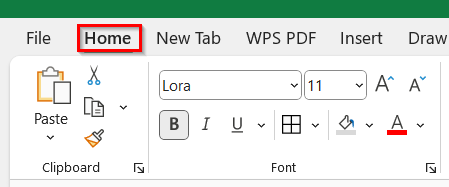
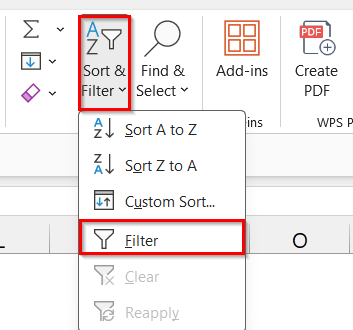
➤ In the Editing group, click Sort & Filter, then select Filter.
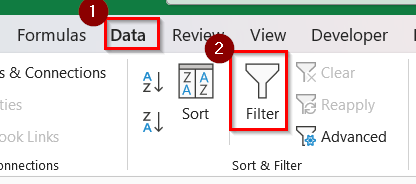
➤ Alternatively, go to the Data tab and click Filter.
➤ After applying the filter, a small drop-down arrow appears in the header cell (A1: “Date”).
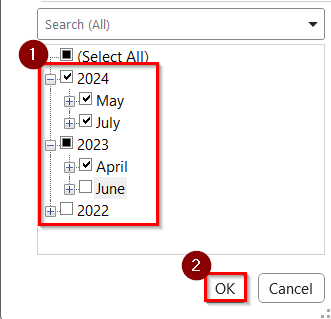
➤ Click on the drop-down arrow next to the Date column header. You will see all the years and months grouped in a hierarchical list (with small plus (+) icons beside each year).
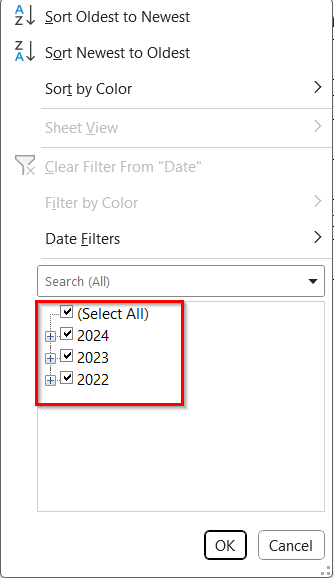
➤ Click the (+) sign beside the year you want to filter to view all the months available under that year.
➤ Mark the checkboxes for the months you want to display (for example, May and June in 2024, April in 2023, and uncheck all others.
➤ Click OK.
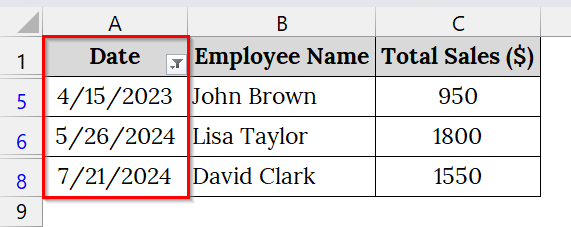
➤ The worksheet will now display only the rows corresponding to the selected month(s) and year.
Note:
➥ Make sure your date cells are formatted as proper dates (not text). You can check this by selecting a date cell and looking at the Number Format box in the Home tab.
➥ You can filter multiple years and months at once if needed.
➥ To remove filters, click Data → Clear or uncheck Filter again.
Using the FILTER Function to Filter Dates by Month and Year
Excel’s FILTER function combined with MONTH and YEAR functions can automatically extract rows that match specific month and year criteria. It’s perfect for dynamic reporting: whenever you change the month or year in your criteria table, Excel instantly updates the filtered results without reapplying filters manually.
For this dataset, we want to automatically filter only the sales made in May 2022 using the Excel FILTER function instead of the manual Filter command. When the month and year are entered in the “Filter Criteria” table, the filtered results dynamically appear in the “Filtered Output” table.
Steps:
➤ Open your Excel file that contains your data. Here, we have Date in Column A, Employee Name in Column B, and Total Sales ($) in Column C.
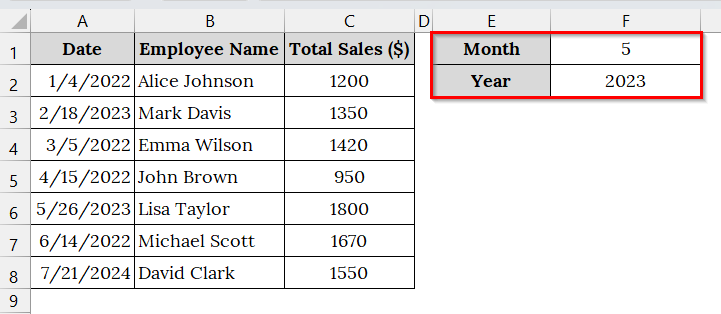
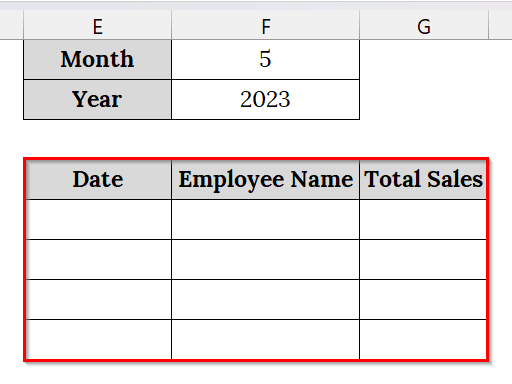
➤ In another section (e.g., cells E1:F2), create two input cells for Month and Year. Label them as:
- E1: “Month”
- F1: Enter the desired month number, e.g., 5.
- E2: “Year”
- F2: Enter the desired year, e.g., 2023.
➤ Now, create an empty Filtered Output table. For example, in cells E4:G8, type the same headers as your original dataset: Date, Employee Name, Total Sales ($).
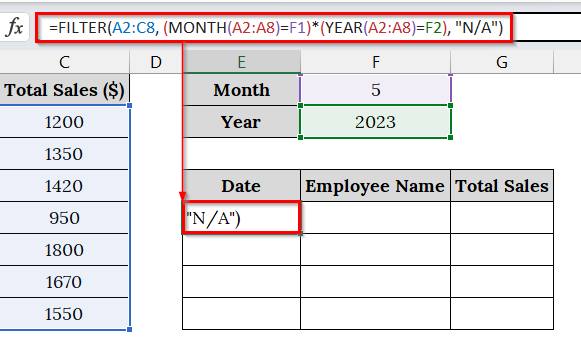
➤ In cell E4, type the following formula:
=FILTER(A2:C8, (MONTH(A2:A8)=F1)*(YEAR(A2:A8)=F2), "N/A")
➥ YEAR(A2:A8)=F2 checks if each date’s year matches the entered year.
➥ The * operator combines both conditions (like an AND).
➥ The "N/A" argument displays if no records are found for the given month/year.
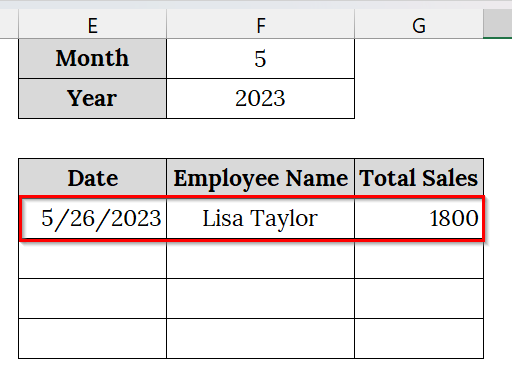
 ➤ Press Enter, Excel will instantly populate the “Filtered Output” table with all rows that match your given month and year (in this case, May 2023).
Note:
You can replace “N/A” with “No Data Found” or any message of your choice.
Using the PivotTable to Filter Dates by Month and Year
Pivot Table is an excellent Excel feature that helps summarize, analyze, and filter data dynamically. We can use it to group our date-based data by month and year, ideal for monthly or yearly sales tracking, attendance logs, or production analysis datasets.
We have a worksheet of a retail store that tracks monthly sales data of its employees for performance analysis. We will quickly check how total sales vary by month and year using a Pivot Table to filter and summarize the information.
Steps:
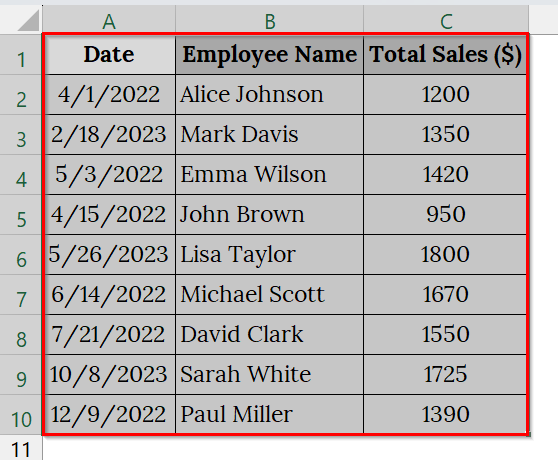
➤ Open your workbook that contains your data. We have Date in Column A, Employee Name in Column B, and Total Sales ($) in Column C.
➤ Click and drag to select your dataset that contains Date, Employee Name, and Total Sales. For example, select cells A1:C10.
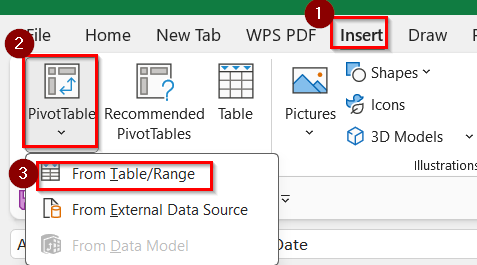
➤ Go to the Insert tab → PivotTable → From Table/Range. A dialog box will appear next.
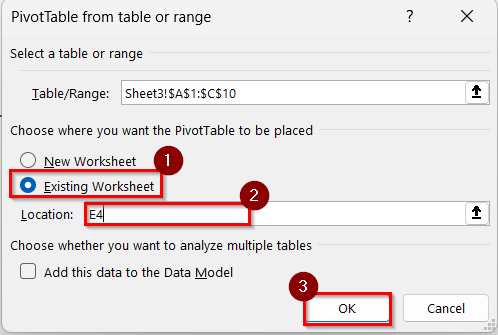
➤ In the dialog box, select Existing Worksheet, and then click the cell where you want to place your Pivot Table (e.g., E4).
➤ Press OK.
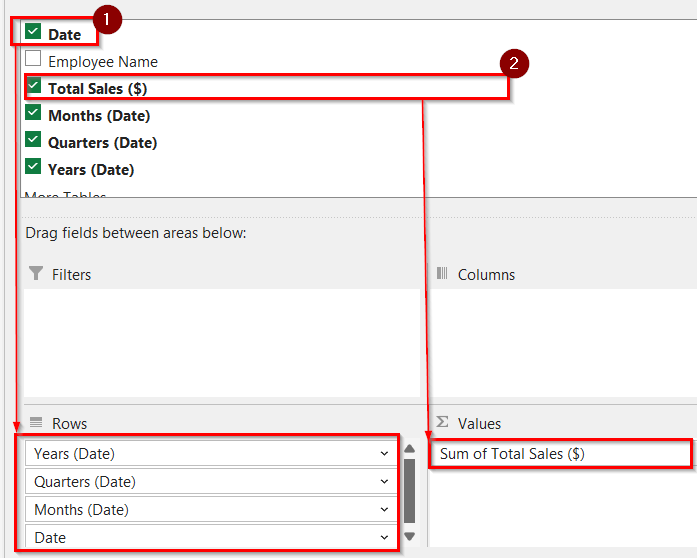
➤ A new PivotTable Field pane appears on the right.
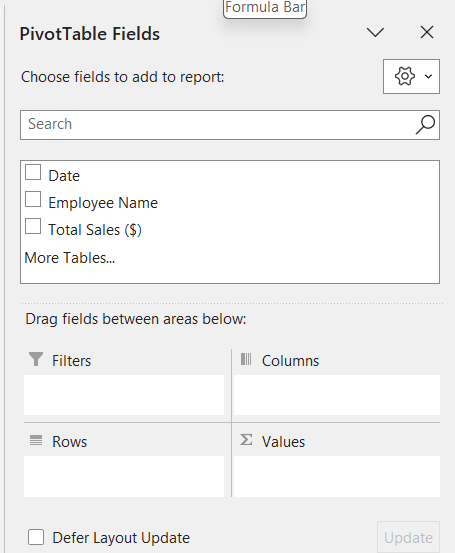
➤ Drag Date into the Rows box. Drag the Sum of Total Sales ($) into the Values box.
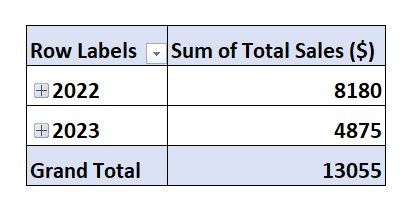
➤ The PivotTable will appear.
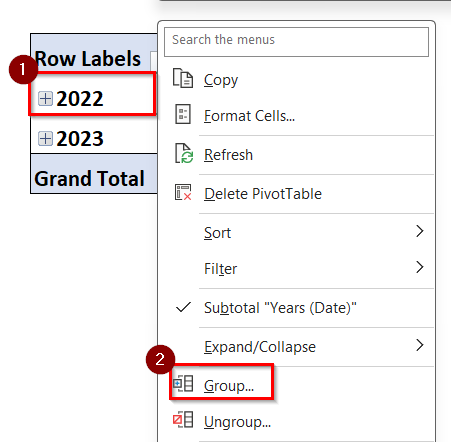
➤ Right-click on any date in the Pivot Table (e.g., 2022) → Choose Group.
➤ Select both Months and Years → Click OK.
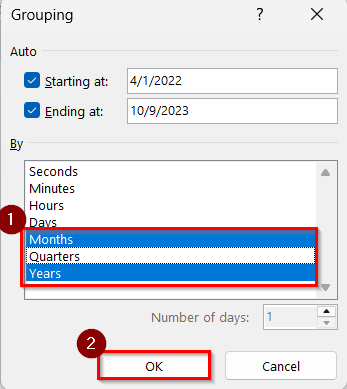
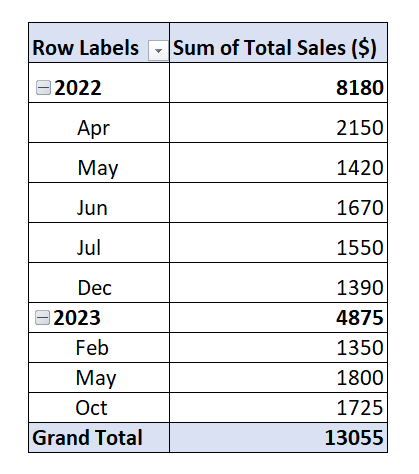
➤ Now, it will show the months and years in the PivotTable.
➤ Move Years to the Columns area so that each year appears as a separate column. Keep Months in the Rows area.
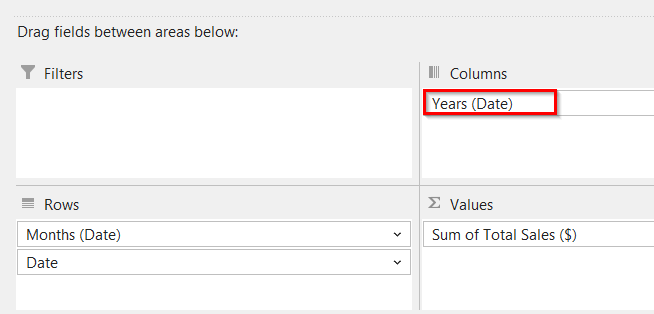
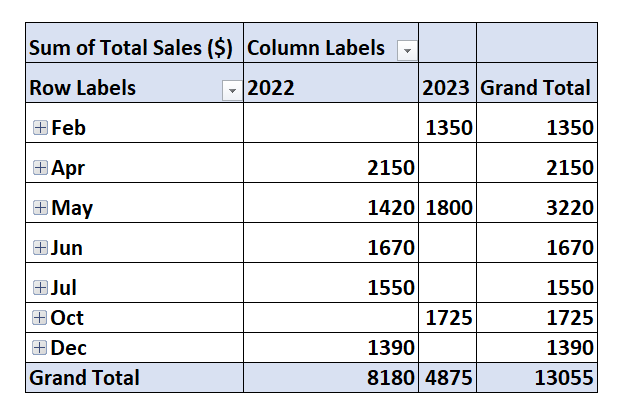
➤ Each year will appear in a separate column.
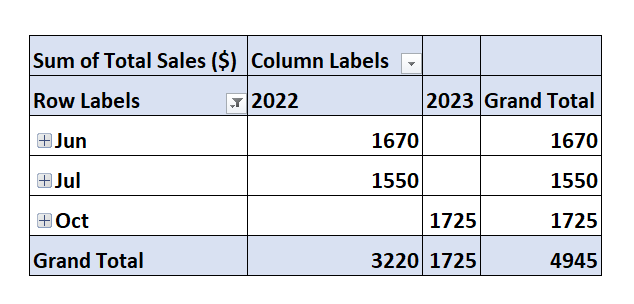
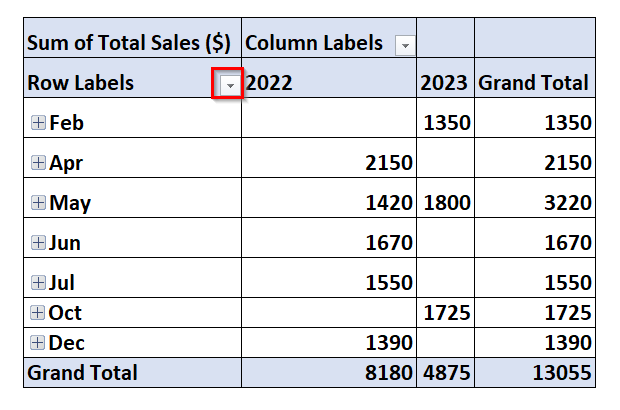
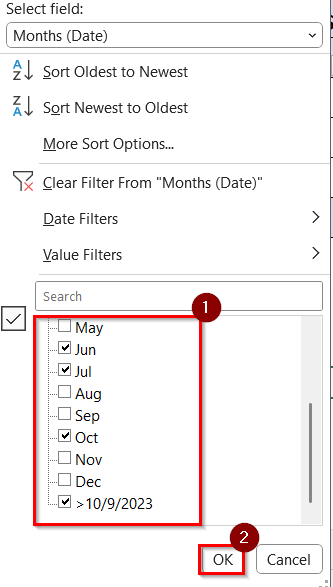
➤ Click the drop-down arrow on Row Labels (Months) or Column Labels (Years) to filter specific months or years.
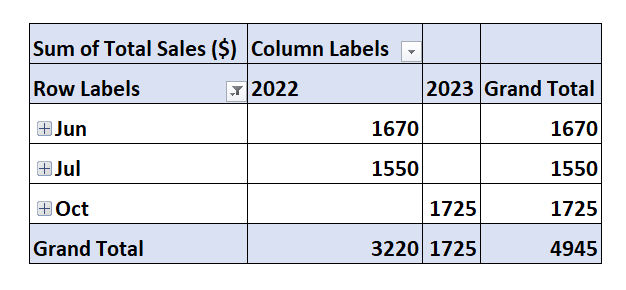
➤ Select the months and year you want to filter. For example, select June and July 2022 and October 2023.
➤ Now, the result will appear in the PivotTable.
Note:
➥ Make sure the Date column is formatted as Date before creating the Pivot Table, or grouping will not work.
➥ Pivot Tables automatically update when new data is added, just click Refresh.
Creating a Custom Filter Button to Filter Dates by Month and Year in Excel
VBA macro can be used to create a custom filter button and to filter date-based records between two specific dates (such as from April 1 to May 31). This is good when handling large tables of invoices, sales, or attendance logs, where manual date filters take too much time. We can define Start Date and End Date dynamically through input boxes each time we run the macro.
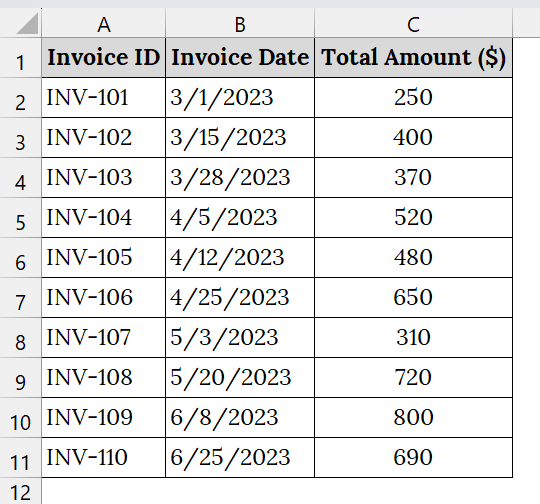
We have a dataset of a small logistics company named “TransPro Ltd.” We will analyze invoice records for a specific date range using VBA instead of manual date filtering. We will create a custom Filter Button for that as well.
Steps:
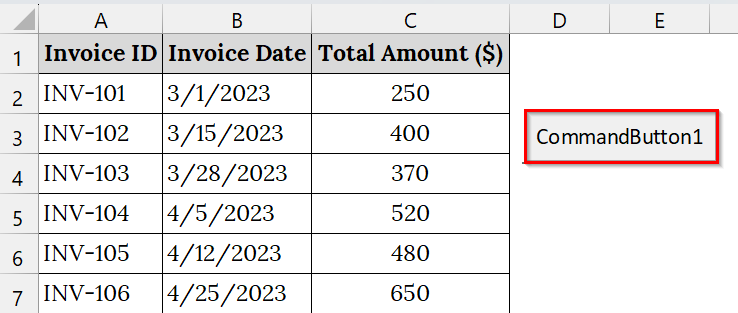
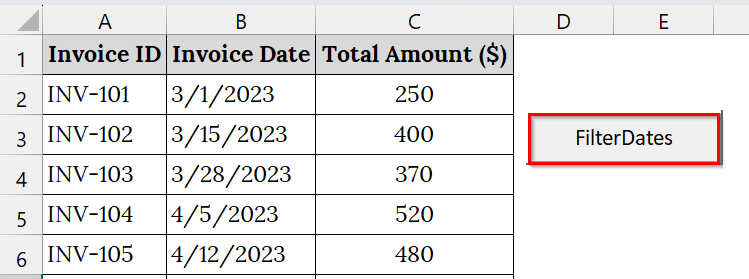
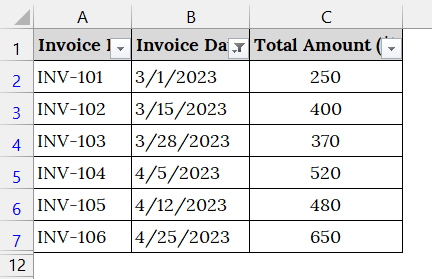
➤ Open your Excel Sheet. We have Invoice ID in Column A, Invoice Date in Column B, and Total Amount ($) in Column C. Ensure your Excel worksheet has a proper date column formatted as a Date type.
➤ Go to the Developer tab.
➤ Click Insert → ActiveX Controls → Command Button (ActiveX).
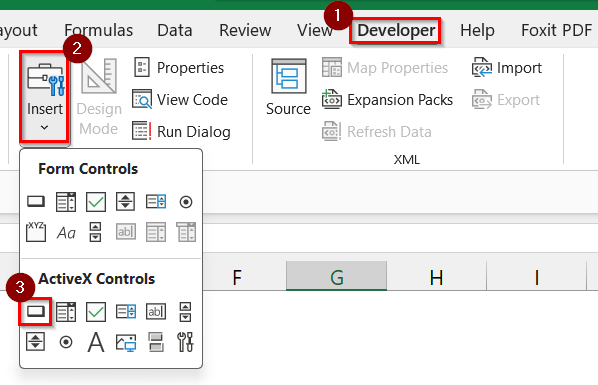 ➤ Draw the button on the worksheet.
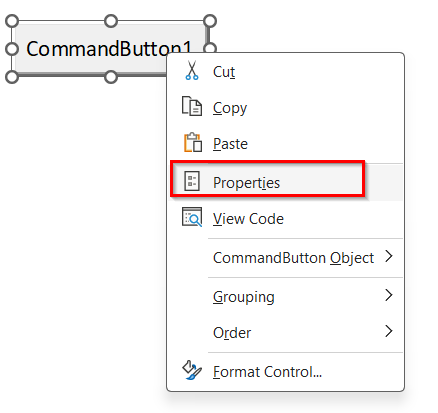
➤ Right-click on the button. Then choose Properties.
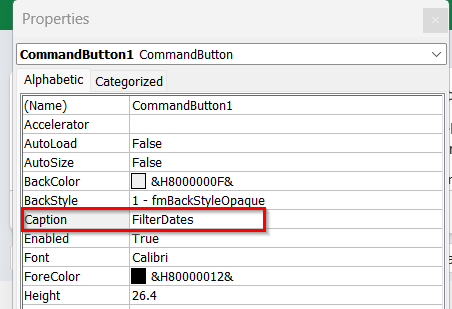
➤ Rename it from CommandButton1 to something meaningful like FilterDates.
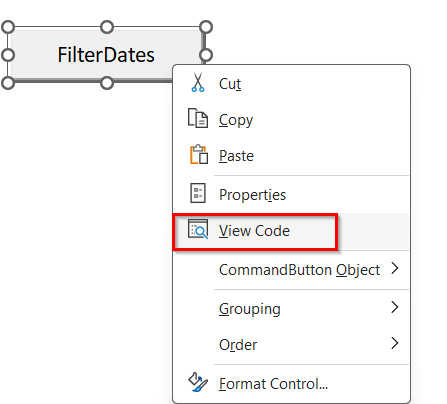
➤ Right-click on the button → View Code.
➤ The VBA editor window will appear.
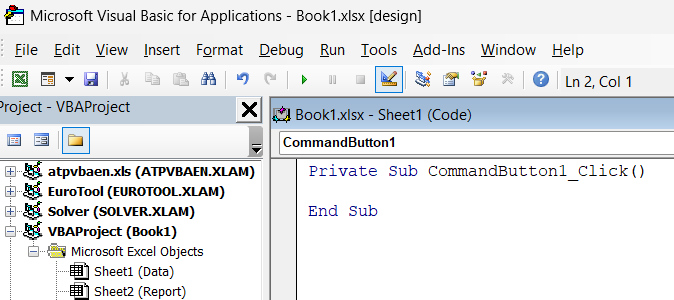
➤ Paste the following VBA code in the opened module:
Private Sub CommandButton1_Click()
    Dim ws As Worksheet
    Dim startDate As Date
    Dim endDate As Date
    Dim lastRow As Long
    Set ws = ThisWorkbook.Sheets("Sheet1") 'Modify if your sheet name differs
    lastRow = ws.Cells(ws.Rows.Count, "B").End(xlUp).Row
    'Ask user to input Start and End Dates
    startDate = InputBox("Enter Start Date (e.g., 4/1/2023):")
    endDate = InputBox("Enter End Date (e.g., 5/31/2023):")
    'Remove existing filters
    ws.AutoFilterMode = False
    'Apply the date range filter
    ws.Range("A1:C" & lastRow).AutoFilter Field:=2, _
        Criteria1:=">=" & startDate, _
        Operator:=xlAnd, _
        Criteria2:="<=" & endDate
    MsgBox "Data filtered between " & Format(startDate, "mmm dd, yyyy") & " and " & Format(endDate, "mmm dd, yyyy")
End Sub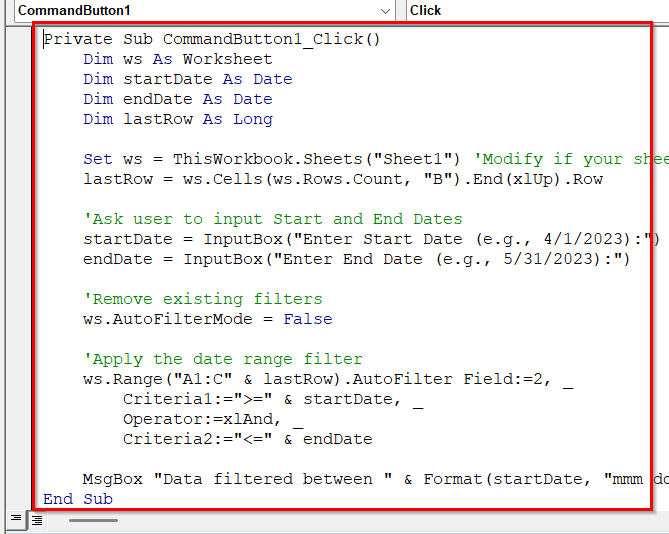
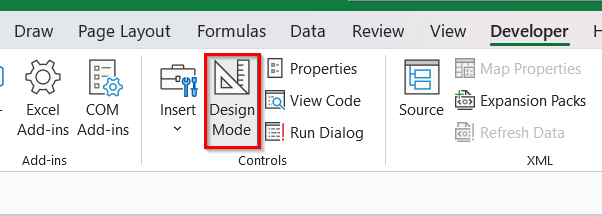
➤ Close the VBA editor, go back to Excel, and turn off Design Mode.
➤ Click the FilterDates button to run the macro.
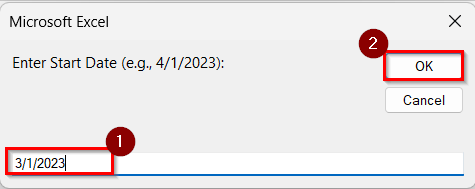
➤ Now, enter the start date (e.g., 3/1/2023) and click OK.
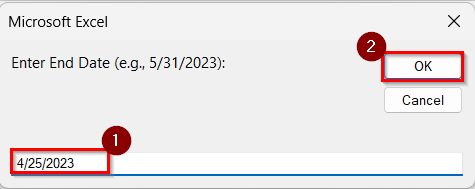
➤ Then, enter the end date and 4/25/2023 and click OK.
➤ The worksheet will display only rows within your selected date range, hiding all other records outside that range.
Note:
➥ Ensure your Invoice Date column is formatted as “Short Date” (MM/DD/YYYY).
➥ Modify “Sheet1” in the VBA code to match your sheet’s name.
➥ To remove the filter and show all records again, click Data → Clear Filter or rerun the macro with a wider date range.
Frequently Asked Questions
Can I filter by month only without considering the year?
Yes. Use the formula =FILTER(A2:C8, MONTH(A2:A8)=F1, “N/A”) to show all records from that month, regardless of the year.
What if my date format is text instead of a date?
You’ll need to convert it using the DATEVALUE function or by changing the cell format to Date before applying the formula.
Can I automate this process using VBA?
Yes. A simple VBA macro can prompt you for a start and end date or specific month/year, then automatically filter your data range.
What happens if there are no matches?
The formula will display “N/A,” indicating no records exist for that month and year.
Concluding Words
Filtering dates by month and year in Excel is necessary for time-based data analysis. Use any method from the FILTER function, Filter Command, PivotTable, or VBA to Filter Dates by Month and Year. All approaches help you quickly isolate relevant records and enhance reporting efficiency. Also, you can download the datasets we have used in this article to practice on your own.