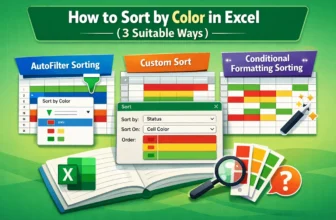
Sorting data by color in Excel is a practical way to organize and analyze information quickly. Many users apply colors to highlight priorities, track statuses, or distinguish categories, but without ...
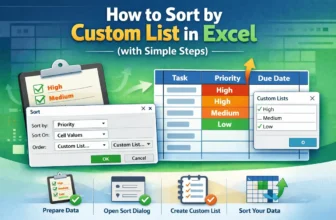
Sorting data in Excel is an effective way to organize and analyze information. While standard ascending or descending sorts work for most tasks, sometimes you need a specific order that matches your ...
Sorting rows by a column in Excel means organizing your data based on the values of one or more columns. For example, you can sort a product list by Revenue (highest to lowest) or by Category (A to ...
Sorting is one of the most common tasks in Excel. Normally, you select your data and use the Sort button to organize it. But what if your dataset changes frequently?For example, when new entries ...
Random sort in Excel means shuffling your data into a new order. Instead of sorting alphabetically or by numbers, Excel mixes up the rows so they appear in a completely random sequence.This is ...
Sorting is one of the most common tasks in Excel when dealing with data. The basic sort option lets you simply arrange values in ascending or descending order. Sometimes, though, you need more ...
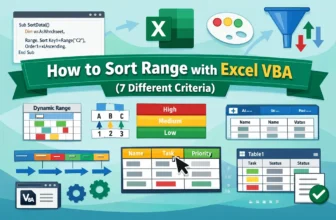
When working with an Excel dataset, sometimes you need to sort data in a specific range to keep your information structured. But sorting manually can be time-consuming. Moreover, there can be chances ...
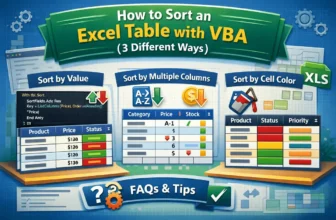
Sorting data helps keep your Excel tables organized, readable, and ready for analysis. While manual sorting works for small datasets, VBA allows you to automate the process, saving time and reducing ...
In data analysis, sorting the columns in a pivot table can be an important part, depending on your data. By sorting, you can organize your data properly and highlight insights that would be helpful ...