A frequency distribution shows the frequency or number of observations within different intervals. You can use Excel functions, features, and add-ins to make a frequency distribution table.➤ ...
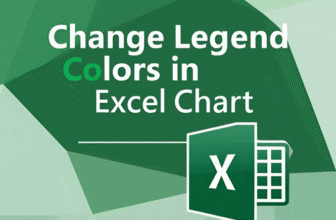
The legend is a section of the chart that indicates what different colors, lines, and areas mean in the chart.The legend always shows the color of the data series. So, to change the legend ...
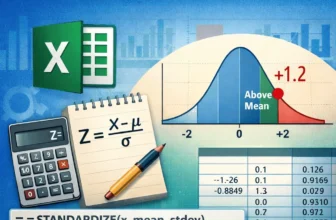
The Z score indicates how many standard deviations a data point is located from the mean value of the dataset. You can use an Excel function or a simple formula to calculate the Z score.➤ The ...
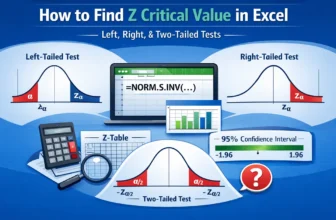
The Z critical value is the boundary value that determines whether a sample data point is statistically significant in the population. It defines the rejection area for the null hypothesis. We can ...
The Friedman test uses ranks to compare more than two groups. It is used when normality and equal variance conditions are not satisfied. Although there are no built-in functions to perform the ...
A legend is a chart element that explains colors, symbols, or patterns used to represent different data series.It always shows what the series represents. So, to change the order of a legend, you ...
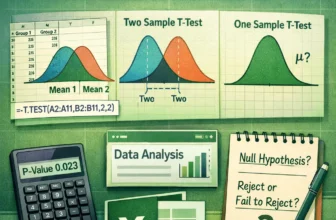
A T-test determines any significant difference between two groups by comparing their mean values. You can use built-in functions and add-ins to do a T-test in Excel.➤ T-test compares two ...
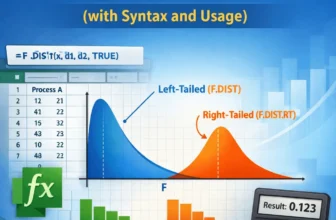
The F.DIST function in Excel returns the left-tailed F probability distribution for two datasets. It signifies the degree of diversity between the datasets.➤ F.DIST function returns the ...
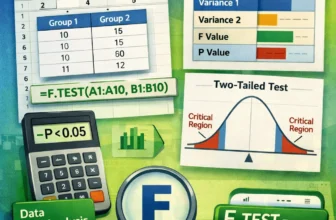
The F-test is a type of hypothesis test that compares the variances of different groups to determine if they differ significantly. You can use built-in add-ins and functions to do F-test in Excel.
...