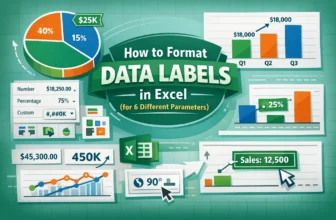
Data labels are part of the chart area that provide more context about data points or areas. It can be numeric values, series names, percentages, etc. In Excel, "Format data labels" can refer to text ...
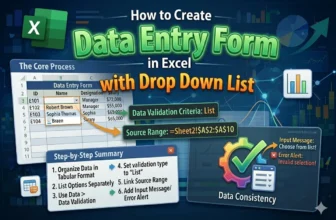
In Excel, users can create a data entry form with a drop down list to enhance usability by limiting choices to predefined options, reducing errors and improving data consistency. If you are new to ...
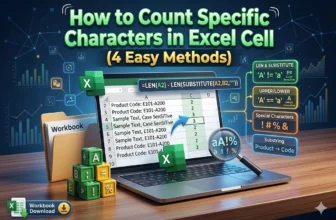
Sometimes, you might need to count how many times specific characters appears in a cell in Excel. For example, you may want to check how often a certain digit appears in a product code, or find out ...
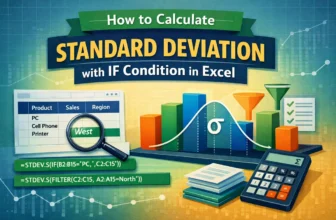
Standard deviation is the variation or dispersion in a set of observations. Sometimes, you may want to calculate the standard deviation for a subset of your data based on a specific condition. You ...
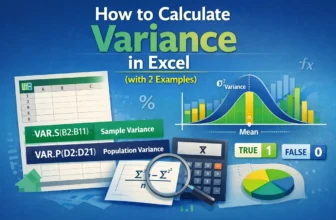
Variance indicates how much the values in a dataset deviate from the mean (average). You can use built-in Excel functions to calculate the variance.➤ Variance measures the degree to which the ...
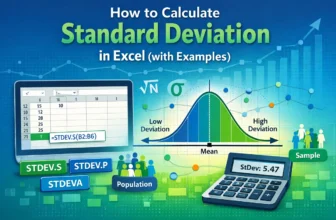
Standard deviation indicates the variation or dispersion of a set of observations. It signifies the deviation of each observation from the mean. You can use built-in Excel functions to calculate the ...
Data labels in Excel are text boxes that appear next to or on top of data points in the chart.Data labels show details such as data values, series, percentages, and other relevant information. ...
For users who are unfamiliar with Excel's technique, a data entry form provides a standard interface for inputting data into a worksheet, making it simpler to explore and enter information. You may ...
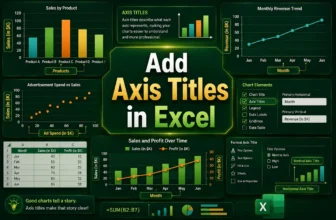
Axis titles are labels that appear alongside the horizontal or vertical axis.Axis titles provide context on what the axes represent. They provide more clarity to the chart, which is the point of ...